February 17, 2026 a 03:31 am

📊 FIX: Dividend Analysis - Comfort Systems USA, Inc.
Comfort Systems USA, Inc. is a reputable entity within the building systems industry, known for its commitment to sustainable dividend policies. With a consistent dividend payment history and a moderate growth forecast, the firm is poised to continue attracting income-focused investors.
Overview 🌟
Comfort Systems USA operates within the construction & engineering sector and has consistently provided shareholder value through dependable dividend payouts. Despite a modest dividend yield of 0.22%, the company boasts an impressive 21-year dividend history without any cuts, reiterating its commitment to shareholders.
| Factor | Details |
|---|---|
| Sector | Construction & Engineering |
| Dividend yield | 0.22% |
| Current dividend per share | 1.20 USD |
| Dividend history | 21 years |
| Last cut or suspension | None |
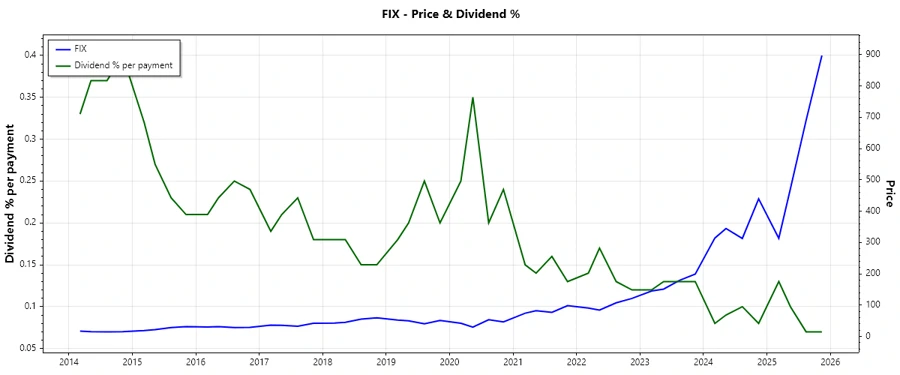
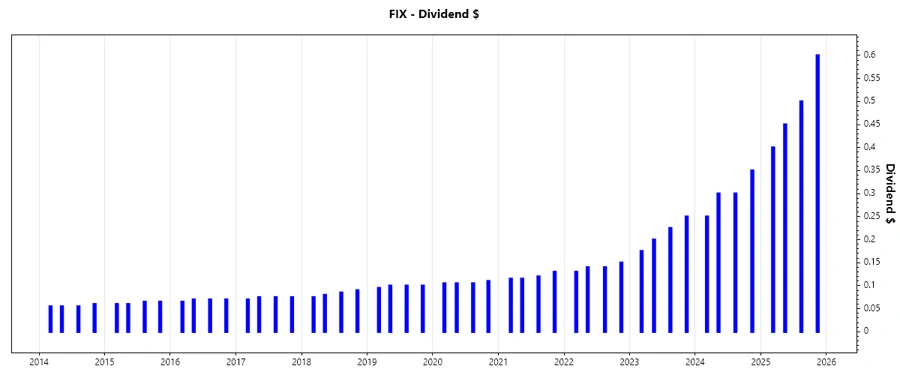
Dividend History 📜
The company's resilience is demonstrated through its consistent dividend payouts, a critical factor for strategic investors seeking income reliability. This strength is reflected in the absence of cuts for over two decades. A sustained payout history positions Comfort Systems USA as a stable income-generating asset for investors.
| Year | Dividend per Share (USD) |
|---|---|
| 2025 | 1.95 |
| 2024 | 1.20 |
| 2023 | 0.85 |
| 2022 | 0.56 |
| 2021 | 0.48 |
Dividend Growth 📈
Understanding the dividend growth rate gives investors insight into potential future income increases. Over the last 5 years, Comfort Systems USA has achieved a dividend growth rate of 35.62%, reinforcing its dedication to delivering shareholder value.
| Time | Growth |
|---|---|
| 3 years | 51.57% |
| 5 years | 35.62% |
The average dividend growth is 35.62% over 5 years. This shows moderate but steady dividend growth.
Payout Ratio ⚖️
Payout ratios are crucial for assessing dividend sustainability. Comfort Systems USA's EPS-based payout ratio of 5.05% suggests a conservative approach to dividend payments, ensuring ample room for reinvestment and financial stability.
| Key figure ratio | Percentage |
|---|---|
| EPS-based | 5.05% |
| Free cash flow-based | 5.29% |
The payout ratios indicate a healthy cushion between earnings and dividends, reassuring investors of Comfort Systems USA’s stable dividend issuance.
Cashflow & Capital Efficiency 💰
Effective cash flow management is imperative for maintaining financial agility. Comfort Systems USA's free cash flow and earnings metrics underscore its effective operations and potential for sustainable dividends.
| Indicator/Year | 2024 | 2023 | 2022 |
|---|---|---|---|
| Free Cash Flow Yield | 4.88% | 7.40% | 6.12% |
| Earnings Yield | 3.45% | 4.39% | 5.95% |
| CAPEX to Operating Cash Flow | 13.08% | 14.82% | 16.04% |
| Stock-based Compensation to Revenue | 0.24% | 0.25% | 0.25% |
| Free Cash Flow / Operating Cash Flow Ratio | 86.92% | 85.17% | 83.96% |
The firm demonstrates stable cash flow, reinforcing its ability to sustain dividend payments while supporting strategic growth through efficient capital allocation.
Balance Sheet & Leverage Analysis 📉
A robust balance sheet mitigates financial risks. Comfort Systems USA maintains minimal leverage, ensuring strategic agility and an optimal capital structure to support sustainable operations.
| Indicator/Year | 2024 | 2023 | 2022 |
|---|---|---|---|
| Debt-to-Equity | 18.10% | 20.09% | 38.92% |
| Debt-to-Assets | 6.55% | 7.77% | 14.98% |
| Debt-to-Capital | 15.33% | 16.73% | 28.01% |
| Net Debt to EBITDA | -0.30 | 0.11 | 1.01 |
| Current Ratio | 1.08 | 1.11 | 1.12 |
| Quick Ratio | 1.06 | 1.07 | 1.09 |
| Financial Leverage | 2.76 | 2.59 | 2.60 |
The leverage metrics suggest a well-managed debt profile, ensuring Comfort Systems USA has the financial fortitude to honor its dividend commitments and maintain operational liquidity.
Fundamental Strength & Profitability 📈
Profitability is central to sustainable dividend policies. Analyzing the company's fundamentals reveals robust performance metrics, highlighting effective operational strategies that translate into shareholder value.
| Indicator/Year | 2024 | 2023 | 2022 |
|---|---|---|---|
| Return on Equity | 30.65% | 25.31% | 24.60% |
| Return on Assets | 11.09% | 9.78% | 9.47% |
| Margins: Net | 7.43% | 6.21% | 5.94% |
| Margins: EBIT | 9.56% | 7.63% | 5.99% |
| Margins: EBITDA | 11.63% | 9.19% | 7.95% |
| Margins: Gross | 21.01% | 19.02% | 17.91% |
| Research & Development to Revenue | 0% | 0% | 0% |
The company's ability to maintain high profitability underscores its effective management and strategic initiatives, ensuring sustained dividend payments and continued growth trajectories.
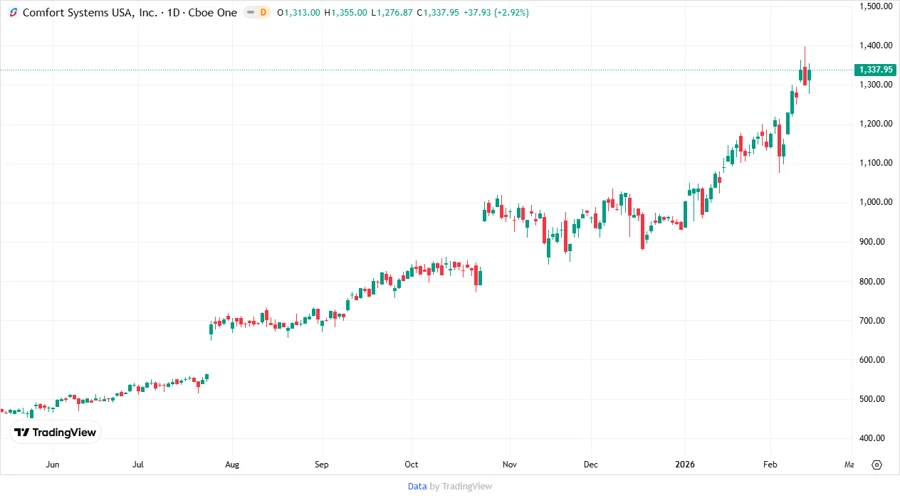
Price Development 📈
Dividend Scoring System 💯
| Category | Score | Bar |
|---|---|---|
| Dividend yield | 2 | |
| Dividend Stability | 5 | |
| Dividend growth | 4 | |
| Payout ratio | 5 | |
| Financial stability | 5 | |
| Dividend continuity | 5 | |
| Cashflow Coverage | 4 | |
| Balance Sheet Quality | 5 |
Total Score: 35/40
Rating 🗣️
With strong fundamentals, dividend consistency, and effective financial management, Comfort Systems USA, Inc. is well-positioned as a reliable dividend-paying company. Investors seeking stable and modest income growth might find this stock worthy of consideration for long-term portfolio inclusion.
Smart Data Insight
Master the Perfect Entry & Exit for this Stock
Don't leave your profits to chance. Historically, this stock follows specific seasonal patterns that institutional traders use to maximize returns.
- ✅ Identify the "Golden Buying Window"
- ✅ Avoid high-risk correction cycles
- ✅ Backtested data from the last 20+ years