January 29, 2026 a 12:46 pm


FIX: Dividend Analysis - Comfort Systems USA, Inc.
The dividend profile of Comfort Systems USA, Inc. demonstrates solid performance with a significant history. With over two decades of uninterrupted dividend payments and moderate growth, it is evident that the company prioritizes returning value to its shareholders. The current dividend yield is modest, but the growth trajectory suggests potential for long-term appreciation. Investors should note this consistency, even under fluctuating market conditions.
📊 Overview
An essential component of evaluating business performance, the company's sector, current yield, dividend per share, and history are pivotal metrics in understanding its financial stability and outlook.
| Metric | Details |
|---|---|
| Sector | Construction & Engineering |
| Dividend Yield | 0.22 % |
| Current Dividend per Share | 1.20 USD |
| Dividend History | 21 years |
| Last Cut or Suspension | None |
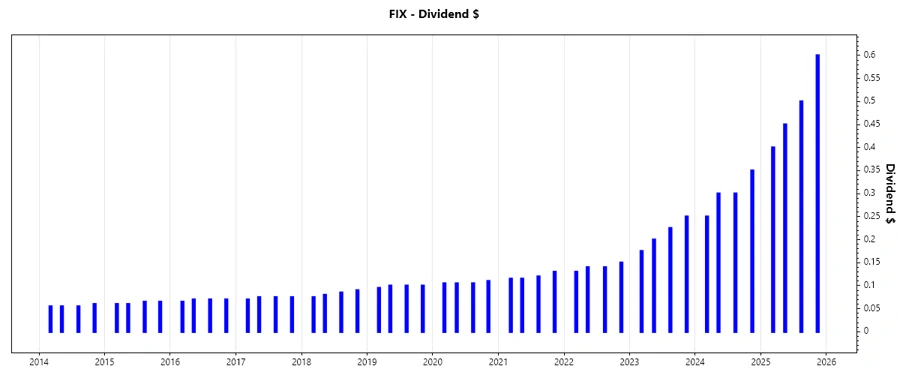
🗣️ Dividend History
A company with a robust dividend history signals dependable income streams and financial health. This history reflects its capacity to honor shareholder investments, especially in adverse economic periods.
| Year | Dividend per Share (USD) |
|---|---|
| 2025 | 1.95 |
| 2024 | 1.20 |
| 2023 | 0.85 |
| 2022 | 0.56 |
| 2021 | 0.48 |
📈 Dividend Growth
Growth in dividends over the years is an indicator of a company’s increasing profitability and confidence in future earnings. It attracts income-focused investors and adds to total return.
| Time | Growth |
|---|---|
| 3 years | 0.52 % |
| 5 years | 0.36 % |
The average dividend growth is 0.36 % over 5 years. This shows moderate but steady dividend growth.
📉 Payout Ratio
Payout ratios analyze the proportion of earnings paid as dividends; they indicate sustainability and potential for future increases. Ratios below 60% are generally considered healthy.
| Key figure | Ratio |
|---|---|
| EPS-based | 5.05 % |
| Free cash flow-based | 5.29 % |
The EPS payout ratio of 5.05 % and FCF payout ratio of 5.29 % indicate the company maintains a conservative and sustainable approach to dividend payouts.
💰 Cashflow & Capital Efficiency
Cashflow analysis provides insights into company liquidity, while capitals efficiency ratios assess how effectively a company utilizes its capital to generate profits. These metrics are essential for evaluating long-term viability.
| Metric | 2024 | 2023 | 2022 |
|---|---|---|---|
| Free Cash Flow Yield | 4.88 % | 7.40 % | 6.12 % |
| Earnings Yield | 3.45 % | 4.39 % | 5.95 % |
| CAPEX to Operating Cash Flow | 13.08 % | 14.82 % | 16.04 % |
| Stock-based Compensation to Revenue | 0.24 % | 0.25 % | 0.25 % |
| Free Cash Flow / Operating Cash Flow Ratio | 86.92 % | 85.17 % | 83.96 % |
The solid cashflow ratios hint at good liquidity, efficient capital allocation, and a positive outlook for retaining and potentially enhancing dividend payouts.
📜 Balance Sheet & Leverage Analysis
Maintaining a healthy balance sheet with optimal debt ratios ensures long-term financial stability. It provides insights into the company's leverage and debt management capability.
| Metric | 2024 | 2023 | 2022 |
|---|---|---|---|
| Debt-to-Equity | 18.10 % | 20.09 % | 38.92 % |
| Debt-to-Assets | 6.55 % | 7.77 % | 14.98 % |
| Debt-to-Capital | 15.33 % | 16.73 % | 28.01 % |
| Net Debt to EBITDA | -0.30 | 0.11 | 1.01 |
| Current Ratio | 1.22 | 1.11 | 1.12 |
| Quick Ratio | 1.05 | 1.07 | 1.09 |
| Financial Leverage | 2.76 | 2.59 | 2.60 |
The company's stable debt management with improving debt ratios reflects its ability to support dividend payouts while nurturing growth opportunities.
🚀 Fundamental Strength & Profitability
Profitability ratios such as ROE and margins identify how efficiently the company is converting shareholder equity and revenue into profit, indicating potential for sustained shareholder returns.
| Metric | 2024 | 2023 | 2022 |
|---|---|---|---|
| Return on Equity | 30.65 % | 25.31 % | 24.60 % |
| Return on Assets | 11.09 % | 9.78 % | 9.47 % |
| Net Margin | 7.43 % | 6.21 % | 5.94 % |
| EBIT Margin | 9.56 % | 7.63 % | 5.99 % |
| EBITDA Margin | 11.63 % | 9.19 % | 7.95 % |
| Gross Margin | 21.01 % | 19.02 % | 17.91 % |
| R&D to Revenue | 0 % | 0 % | 0 % |
The high returns on equity and growing profit margins highlight the company’s ability to maximize profitability and deliver shareholder value.
📈 Price Development
✅ Dividend Scoring System
| Category | Details | Score |
|---|---|---|
| Dividend Yield | 0.22 % | 2 |
| Dividend Stability | 21 years without cut | 5 |
| Dividend Growth | 0.36 % (5 years) | 3 |
| Payout Ratio | EPS 5.05 %, FCF 5.29 % | 4 |
| Financial Stability | Improving debt metrics | 4 |
| Dividend Continuity | No interruptions | 5 |
| Cashflow Coverage | FCF positive | 4 |
| Balance Sheet Quality | Healthy ratios | 4 |
Total Score: 31/40
🌟 Rating
Comfort Systems USA, Inc. demonstrates a strong foundation with a focus on sustainable growth and financial health. With its strong balance sheet, improving margins, and commitment to dividend payments, it presents a reliable option for income-oriented investors seeking stable returns with growth potential. The company is recommended as a hold for those already invested and a potential buy for income-seeking investors who can accommodate moderate yield with an eye on long-term appreciation.