January 21, 2026 a 03:31 pm

📊 : Dividend Analysis - Comfort Systems USA, Inc.
Comfort Systems USA, Inc. presents itself as a stable dividend distributer with a history stretching over 21 years, showcasing reliability for income-seeking investors. However, with a modest current dividend yield of 0.22%, the stock might not suit those seeking high immediate income. Their continuous dividend history, devoid of cuts or suspensions, suggests a resilient financial strategy, even in challenging economic climates.
🗣️ Overview
As an entity in the construction and engineering sector, Comfort Systems USA offers insights into its dividend policy and financial robustness through key data points.
| Metric | Value |
|---|---|
| Sector | Construction & Engineering |
| Dividend Yield | 0.22% |
| Current Dividend per Share | 1.20 USD |
| Dividend History | 21 years |
| Last Cut or Suspension | None |
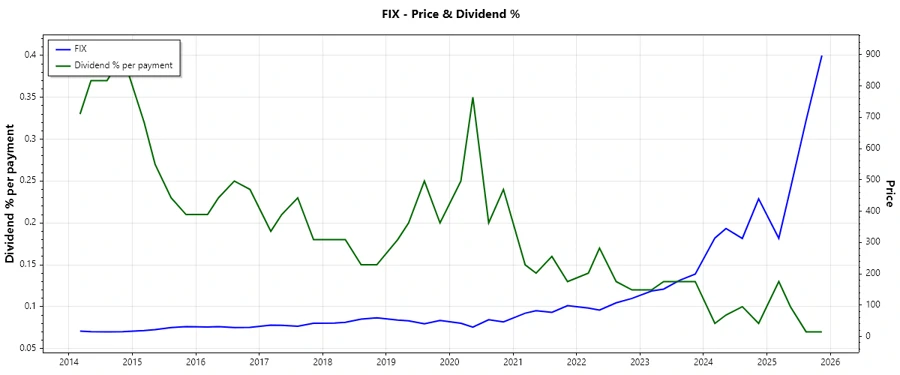
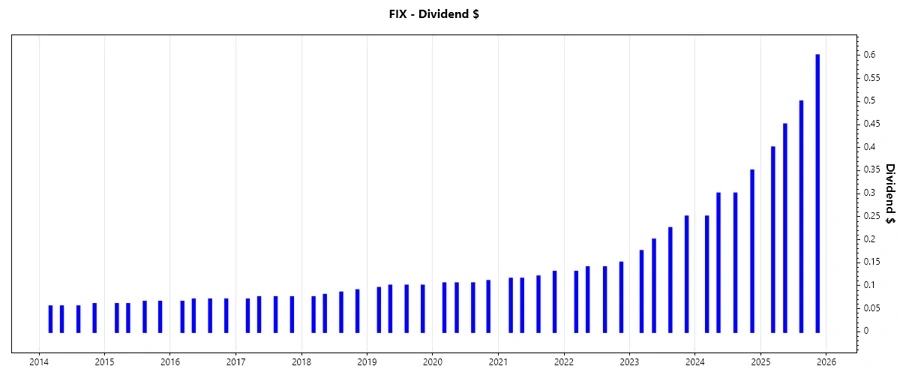
📈 Dividend History
Understanding the history of dividend payments can indicate the company’s ability to sustain shareholder rewards. A solid history often reflects the company's capacity for generating consistent cash flows.
| Year | Dividend per Share (USD) |
|---|---|
| 2025 | 1.95 |
| 2024 | 1.20 |
| 2023 | 0.85 |
| 2022 | 0.56 |
| 2021 | 0.48 |
🔼 Dividend Growth
Assessing dividend growth provides vital insights into the company's prioritization of shareholder returns and growth in profitability. It signifies a firm’s confidence in its future cash flows.
| Time | Growth |
|---|---|
| 3 years | 51.57% |
| 5 years | 35.62% |
The average dividend growth is 35.62% over 5 years, indicating moderate but steady growth, which bodes well for long-term investors.
⚖️ Payout Ratio
Payout ratios quantify the proportion of earnings and cash flow returned as dividends. Secure ratios suggest dividends are well-covered by earnings and cash flow.
| Key Figure | Ratio |
|---|---|
| EPS-based | 5.05% |
| Free cash flow-based | 5.29% |
With an EPS payout ratio of 5.05% and a FCF payout ratio of 5.29%, dividends are remarkably well covered, depicting potential for sustainable increases or capital allocation priorities.
💵 Cashflow & Capital Efficiency
Analyzing cash flow metrics provides insights into operational effectiveness and capital deployment, pivotal for understanding future dividend sustainability.
| Metric | 2024 | 2023 | 2022 |
|---|---|---|---|
| Free Cash Flow Yield | 4.88% | 7.40% | 6.12% |
| Earnings Yield | 3.45% | 4.39% | 5.95% |
| CAPEX to Operating Cash Flow | 13.08% | 14.83% | 16.04% |
| Stock-based Compensation to Revenue | 0.24% | 0.25% | 0.25% |
| Free Cash Flow / Operating Cash Flow Ratio | 86.92% | 85.17% | 83.96% |
The cash flow metrics reveal consistent capital efficiency, backing potential future increases in dividends or other shareholder returns.
📉 Balance Sheet & Leverage Analysis
Leverage ratios and balance sheet strength determine the financial stability and potential risks affecting dividend sustainability.
| Metric | 2024 | 2023 | 2022 |
|---|---|---|---|
| Debt-to-Equity | 18.10% | 20.09% | 38.92% |
| Debt-to-Assets | 6.55% | 7.77% | 14.98% |
| Debt-to-Capital | 15.33% | 16.73% | 28.01% |
| Net Debt to EBITDA | -0.30 | 0.11 | 1.01 |
| Current Ratio | 1.22 | 1.11 | 1.12 |
| Quick Ratio | 1.06 | 1.07 | 1.09 |
| Financial Leverage | 2.76 | 2.59 | 2.60 |
The company maintains a low leverage position, demonstrating a robust ability to meet its financial obligations and sustain its dividends.
✅ Fundamental Strength & Profitability
Key profitability ratios reflect the operational efficiency and value generated relative to company resources.
| Metric | 2024 | 2023 | 2022 |
|---|---|---|---|
| Return on Equity | 30.65% | 25.31% | 24.60% |
| Return on Assets | 11.09% | 9.78% | 9.47% |
| Net Profit Margin | 7.43% | 6.21% | 5.94% |
| EBIT Margin | 9.56% | 7.63% | 5.99% |
| EBITDA Margin | 11.63% | 9.19% | 7.95% |
| Gross Margin | 21.01% | 19.02% | 17.91% |
| R&D to Revenue | 0% | 0% | 0% |
With strong profitability metrics, Comfort Systems USA is positioned strongly to leverage core strengths into sustained shareholder returns.
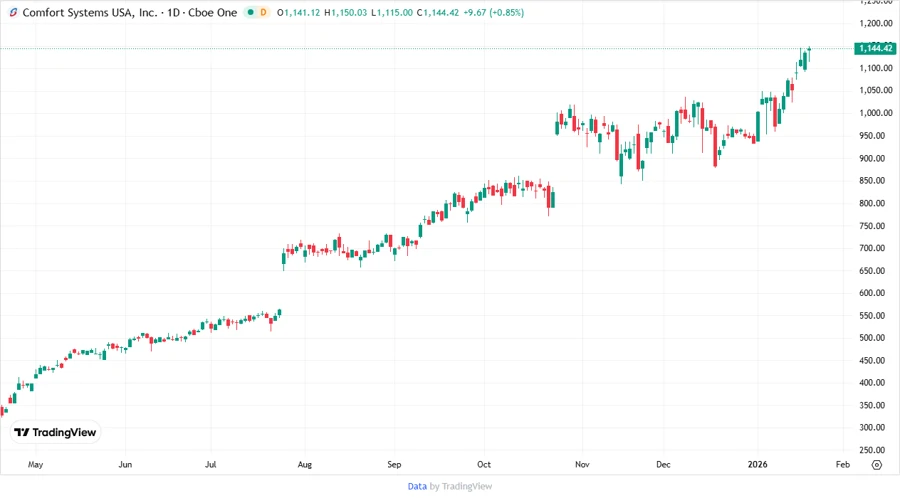
📉 Price Development
🔍 Dividend Scoring System
| Criteria | Score (Out of 5) | Score Bar |
|---|---|---|
| Dividend Yield | 2 | |
| Dividend Stability | 5 | |
| Dividend Growth | 4 | |
| Payout Ratio | 5 | |
| Financial Stability | 5 | |
| Dividend Continuity | 5 | |
| Cashflow Coverage | 4 | |
| Balance Sheet Quality | 5 |
Total Score: 35 out of 40
⭐ Rating
Comfort Systems USA, Inc. receives a strong rating, commendable for its impressive financial stability and commitment to dividend payments. While the current yield is modest, its stability and growth endeavor render it an appealing proposition for the conservative income investor.