May 23, 2025 a 02:03 pm

FITB: Trend and Support & Resistance Analysis - Fifth Third Bancorp
Fifth Third Bancorp has demonstrated significant movement in its stock price over recent months. As a diversified financial services company, its performance reflects broader economic conditions. Analyzing trends and support/resistance zones is essential for making informed investment decisions.
Trend Analysis
| Date | Closing Price | Trend |
|---|---|---|
| 2025-05-23 | $37.06 | ▼ (Down) |
| 2025-05-22 | $37.51 | ▼ (Down) |
| 2025-05-21 | $37.59 | ▲ (Up) |
| 2025-05-20 | $39.07 | ▲ (Up) |
| 2025-05-19 | $39.51 | ▲ (Up) |
| 2025-05-16 | $39.64 | ▲ (Up) |
| 2025-05-15 | $39.49 | ▲ (Up) |
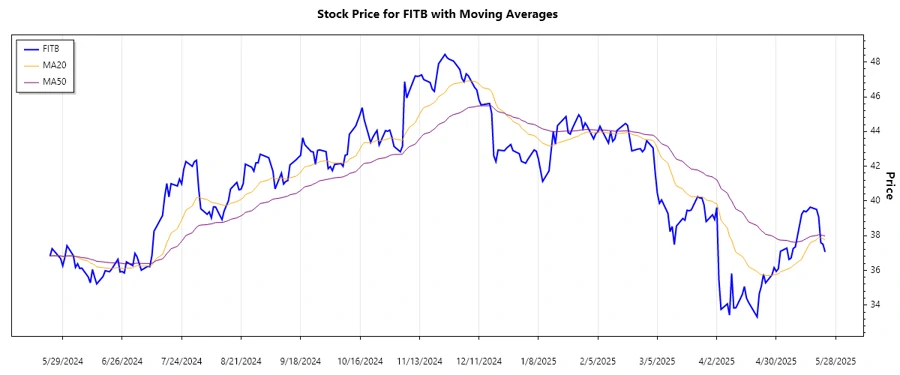
Based on the EMA analysis, the short-term trend indicates an upward movement until recent declines showcase signs of potential reversals. Monitoring these dynamics can guide future investments.
Support and Resistance
| Zone Type | From | To |
|---|---|---|
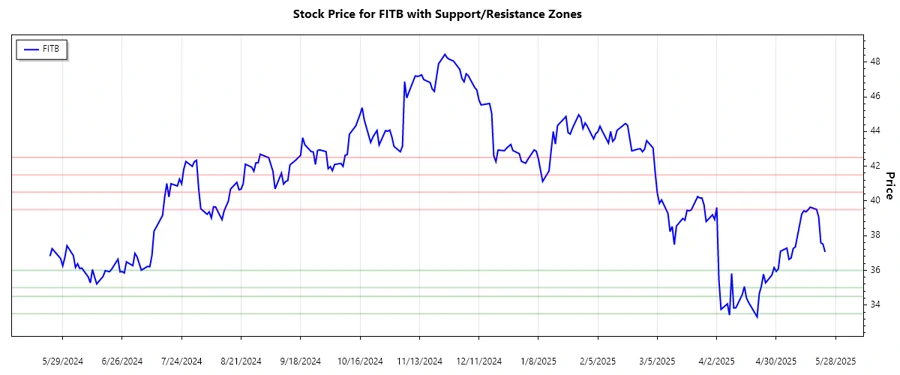
| Support Zone | $35.00 | $36.00 |
| Support Zone | $33.50 | $34.50 |
| Resistance Zone | $39.50 | $40.50 |
| Resistance Zone | $41.50 | $42.50 |
The current price is hovering near the lower support zone, suggesting a potential rebound. If breached, further declines are possible. Evidence of breakthrough resistance levels might signal continuation of upward momentum.
Conclusion
The analysis of Fifth Third Bancorp's stock illustrates certain volatility with recent shifts toward breaking support zones. Despite this, the bank's robust business model provides a potential cushion against market fluctuations. Investors are advised to consider external economic influences while leveraging technical analysis for future decisions, bearing in mind the risks and opportunities linked to financial sector investments.
Smart Data Insight
Master the Perfect Entry & Exit for this Stock
Don't leave your profits to chance. Historically, this stock follows specific seasonal patterns that institutional traders use to maximize returns.
- ✅ Identify the "Golden Buying Window"
- ✅ Avoid high-risk correction cycles
- ✅ Backtested data from the last 20+ years