May 20, 2026 a 06:44 am
FITB: Fibonacci Analysis - Fifth Third Bancorp
The stock of Fifth Third Bancorp (FITB) has recently shown signs of recovery after experiencing a downward trend. The company’s strong fundamentals and diversified financial services position it well in the financial sector. Recent price movements suggest potential opportunities for investors keen on capitalizing on market corrections.
Fibonacci Analysis
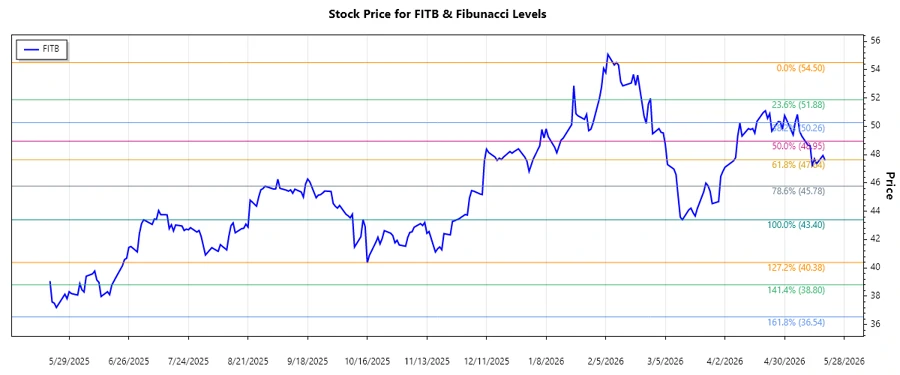
Based on the historical data, a recent downtrend is identified from a high of $54.5 on February 10, 2026, to a low of $43.4 on March 13, 2026. This analysis provides Fibonacci retracement levels to identify potential support and resistance points.
| Metric | Detail |
|---|---|
| Trend Start Date | 2026-02-10 |
| Trend End Date | 2026-03-13 |
| High Price | $54.5 |
| Low Price | $43.4 |
| Fibonacci Level 0.236 | $46.778 |
| Fibonacci Level 0.382 | $48.604 |
| Fibonacci Level 0.5 | $48.95 |
| Fibonacci Level 0.618 | $50.396 |
| Fibonacci Level 0.786 | $52.364 |
| Current Price | $47.6 (as of most recent close) |
| Retracement Zone | 0.236 |
| Technical Interpretation | The current price is within the 0.236 retracement level, suggesting potential support at this level and an opportunity for a reversal upwards. |
Conclusion
The Fibonacci analysis of Fifth Third Bancorp indicates that the stock is currently in a potential rebound phase after experiencing a downtrend. The recent breakthrough of the 0.236 retracement level could act as a support point, signaling a possible upward momentum in the near term. Investors should be cautious of volatility and remain updated with economic factors impacting the financial services sector. Overall, Fifth Third Bancorp maintains a robust position in the market: its diversified portfolio and extensive banking network continue to be advantageous amidst fluctuating market conditions.
Smart Data Insight
Master the Perfect Entry & Exit for this Stock
Don't leave your profits to chance. Historically, this stock follows specific seasonal patterns that institutional traders use to maximize returns.
- ✅ Identify the "Golden Buying Window"
- ✅ Avoid high-risk correction cycles
- ✅ Backtested data from the last 20+ years