February 18, 2026 a 05:15 am

FITB: Fibonacci Analysis - Fifth Third Bancorp
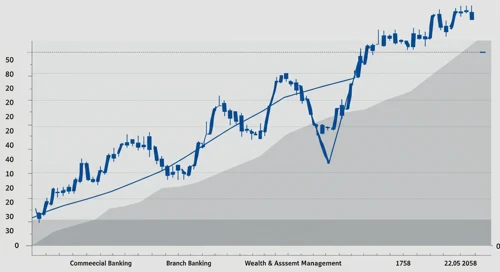
Fifth Third Bancorp (FITB) has demonstrated strong resilience in its financial performance in recent months. The stock has recently been in an upward trend, reflecting investor confidence in the diversified financial services offered by the company. The technical indicators point to a potential continuation of this trend, albeit with some possible retracement levels that could present buying opportunities.
Fibonacci Analysis
The analysis covers a period from November 19, 2025, to February 10, 2026. This period shows a significant upward trend with the stock price reaching a high of $54.5 on February 10, 2026, and a low of $41.28 on November 20, 2025. Based on this trend, Fibonacci levels have been calculated to identify potential support and resistance zones.
| Start Date | End Date | High Point | Low Point |
|---|---|---|---|
| 2025-11-20 | 2026-02-10 | $54.5 (2026-02-10) | $41.28 (2025-11-20) |
| Fibonacci Level | Price Level |
|---|---|
| 0.236 | $51.54 |
| 0.382 | $49.75 |
| 0.5 | $47.89 |
| 0.618 | $46.02 |
| 0.786 | $43.73 |
The current price of Fifth Third Bancorp is around $53.06, which suggests that the stock is within the 0.236 retracement zone. This could indicate a potential area of resistance. If the price breaks through this level, it may signal further upward momentum, whereas a pullback could test the lower Fibonacci levels for support.
Conclusion
Fifth Third Bancorp is exhibiting strong bullish momentum, bolstered by its diversified services across commercial and branch banking, as well as wealth management. The upward trend and Fibonacci analysis suggest potential support at lower levels, indicating good entry points for potential investors. However, given the volatility in the banking sector, caution is advised. The resistance at the 0.236 Fibonacci level may pose a temporary challenge, but a break past this could propel the stock to new highs, making it an attractive option in the financial sector.