October 08, 2025 a 03:15 pm
FITB: Fibonacci Analysis - Fifth Third Bancorp
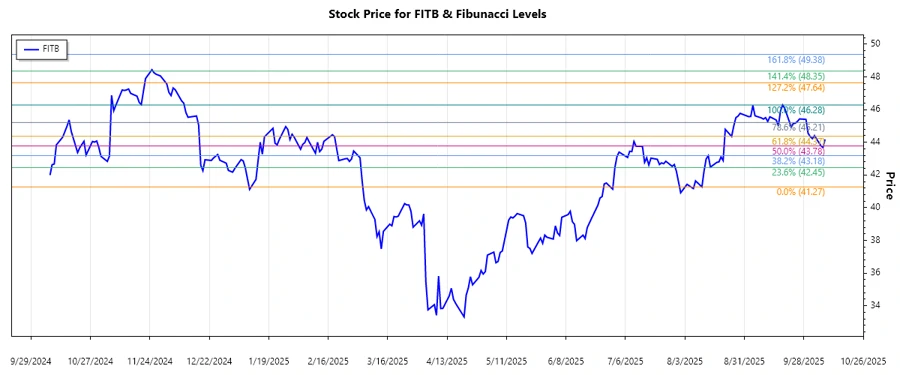
The stock of Fifth Third Bancorp has shown a notable upward trend over the past few months. This trend reflects a positive sentiment among investors, potentially due to strong financial performance and strategic business developments. As the company continues to expand its service offerings, this upswing could be a precursor to further growth. However, as with any stock, there are inherent risks to consider, including market volatility and sector-specific challenges.
Fibonacci Analysis
| Details | Information | ||||||||||||
|---|---|---|---|---|---|---|---|---|---|---|---|---|---|
| Trend Start Date | 2025-08-11 | ||||||||||||
| Trend End Date | 2025-09-19 | ||||||||||||
| High Price & Date | 46.28 on 2025-09-18 | ||||||||||||
| Low Price & Date | 41.27 on 2025-08-11 | ||||||||||||
| Fibonacci Levels |
|
||||||||||||
| Current Price Level | The current price is within the 0.382 Fibonacci retracement level range. | ||||||||||||
| Technical Interpretation | This retracement level suggests potential support, indicating that buyers may step in to uphold prices and prevent further declines. It's an important juncture to watch for potential reversals back to the previous highs. |
Conclusion
The stock of Fifth Third Bancorp has been on an upward trajectory, likely driven by steadfast growth in their diversified financial services. As the current price enters a key Fibonacci retracement level, it offers a potential support zone, which could attract more buyers. While the bullish sentiment prevails, investors should remain cautious of broader economic indicators that might impact the financial sector. This Fibonacci analysis provides valuable insights for analysts to anticipate potential price reactions and plan accordingly. However, it is crucial for investors to weigh both macroeconomic factors and company-specific developments in their decision-making process.
Smart Data Insight
Master the Perfect Entry & Exit for this Stock
Don't leave your profits to chance. Historically, this stock follows specific seasonal patterns that institutional traders use to maximize returns.
- ✅ Identify the "Golden Buying Window"
- ✅ Avoid high-risk correction cycles
- ✅ Backtested data from the last 20+ years