
July 26, 2026 a 02:46 am

FITB: Dividend Analysis - Fifth Third Bancorp
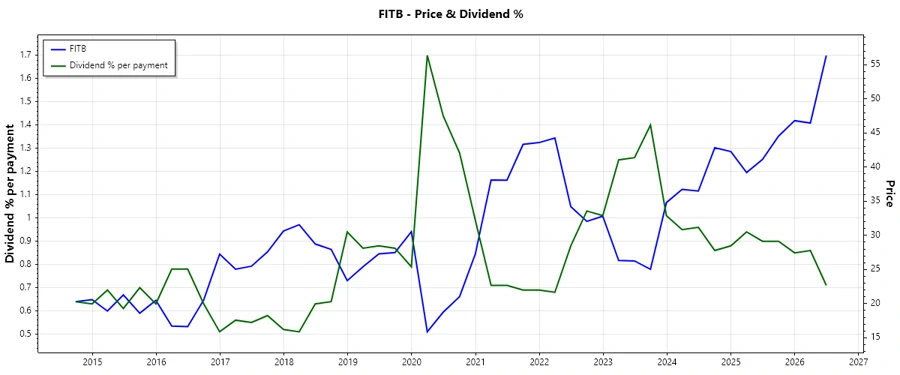
Fifth Third Bancorp demonstrates a solid dividend profile characterized by a reasonably attractive yield and a consistent history of dividend payments. The company exhibits an encouraging dividend growth trend over the past five years, reflecting its commitment to returning value to shareholders. However, investors should consider the payout ratio to ensure sustainable payout levels aligned with its earnings and free cash flow. 🏦
📊 Overview
| Metric | Value |
|---|---|
| Sector | Financial Services |
| Dividend Yield | 2.84% |
| Current Dividend per Share | 1.75 USD |
| Dividend History | 43 years |
| Last Cut/Suspension | None |
📈 Dividend History
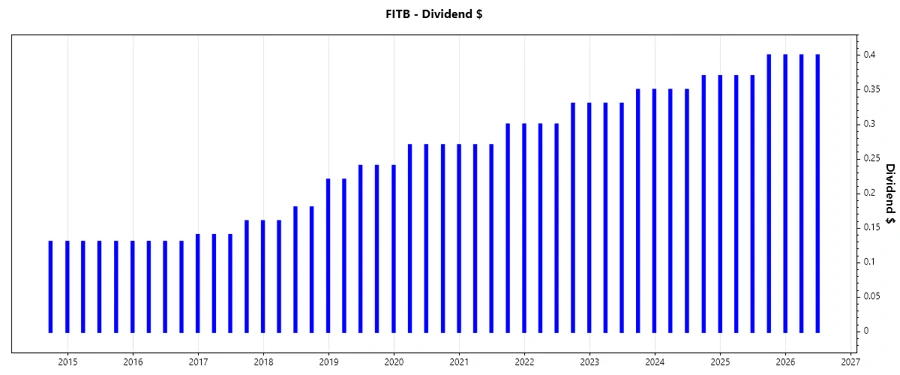
Fifth Third Bancorp has a strong dividend history, underpinning its reputation among income-focused investors. The regularity of payments and the track record of growth provide an element of predictability and stability, appealing to investors seeking steady income streams.
| Year | Dividend per Share (USD) |
|---|---|
| 2026 | 0.8 |
| 2025 | 1.54 |
| 2024 | 1.44 |
| 2023 | 1.36 |
| 2022 | 1.26 |
📉 Dividend Growth
The sustained growth in dividends highlights Fifth Third Bancorp's ability to increase shareholder returns over time, a positive signal of its financial resilience and profitability.
| Time | Growth |
|---|---|
| 3 years | 6.92% |
| 5 years | 7.35% |
The average dividend growth is 7.35% over 5 years. This shows moderate but steady dividend growth.
✅ Payout Ratio
The payout ratio is a key indicator of dividend sustainability. Fifth Third Bancorp's payment ratios suggest a balanced approach to distributing earnings, with adequate retained earnings for future growth.
| Key Figure | Ratio |
|---|---|
| EPS-based | 68.02% |
| FCF-based | 79.96% |
These ratios indicate that the company is allocating a significant portion of its earnings and free cash flow to dividends. This level raises a caution flag regarding flexibility in adverse economic conditions, although it remains within a manageable range. ⚠️
💰 Cashflow & Capital Efficiency
The financial health of a company is reflected in its cash flow and capital efficiency measures. Fifth Third Bancorp's figures illustrate its capacity to generate cash relative to earnings and manage its capital investments prudently.
| Year | 2025 | 2024 | 2023 |
|---|---|---|---|
| Free Cash Flow Yield | 12.23% | 8.36% | 16.92% |
| Earnings Yield | 8.11% | 8.02% | 9.95% |
| CAPEX to Operating Cash Flow | 15.71% | 14.66% | 11.44% |
| Stock-based Compensation to Revenue | 1.27% | 1.25% | 1.37% |
| Free Cash Flow / Operating Cash Flow | 84.29% | 85.34% | 88.56% |
Fifth Third Bancorp maintains healthy cash flow coverage, allowing for operational flexibility and capital investments that bolster long-term growth. 📈
📊 Balance Sheet & Leverage Analysis
A well-managed balance sheet reflects a company's ability to manage its debts and maintain liquidity. Fifth Third Bancorp's leverage ratios and liquidity position suggest a balanced financial structure.
| Year | 2025 | 2024 | 2023 |
|---|---|---|---|
| Debt-to-Equity | 66.82% | 96.57% | 101.35% |
| Debt-to-Assets | 6.77% | 8.91% | 9.06% |
| Debt-to-Capital | 40.05% | 49.13% | 50.34% |
| Net Debt to EBITDA | 3.05 | 4.68 | 4.72 |
| Current Ratio | 0.82 | 0.38 | 0.47 |
| Quick Ratio | 0.82 | 0.38 | 0.47 |
| Financial Leverage | 9.87 | 10.84 | 11.19 |
With leverage ratios trending upwards, it's important for Fifth Third Bancorp to prudently manage debt levels to prevent financial strain. 🗣️
📈 Fundamental Strength & Profitability
Fifth Third Bancorp's profitability metrics demonstrate its capacity to generate returns on equity and assets, which reflect its operational success and ability to invest in future growth. Margins indicate efficiency in cost control and revenue generation.
| Year | 2025 | 2024 | 2023 |
|---|---|---|---|
| Return on Equity | 11.61% | 11.78% | 12.25% |
| Return on Assets | 1.18% | 1.09% | 1.09% |
| Net Margin | 19.61% | 17.73% | 19.01% |
| EBIT Margin | 24.95% | 22.35% | 24.18% |
| EBITDA Margin | 28.10% | 26.14% | 27.92% |
| Gross Margin | 65.29% | 59.18% | 63.99% |
| R&D to Revenue | 0.9949% | 0% | 0% |
Strong margins and returns indicate a robust operational framework, with room for further investment in growth and innovation. Fifth Third Bancorp is positioned well for sustained profitability. ✅
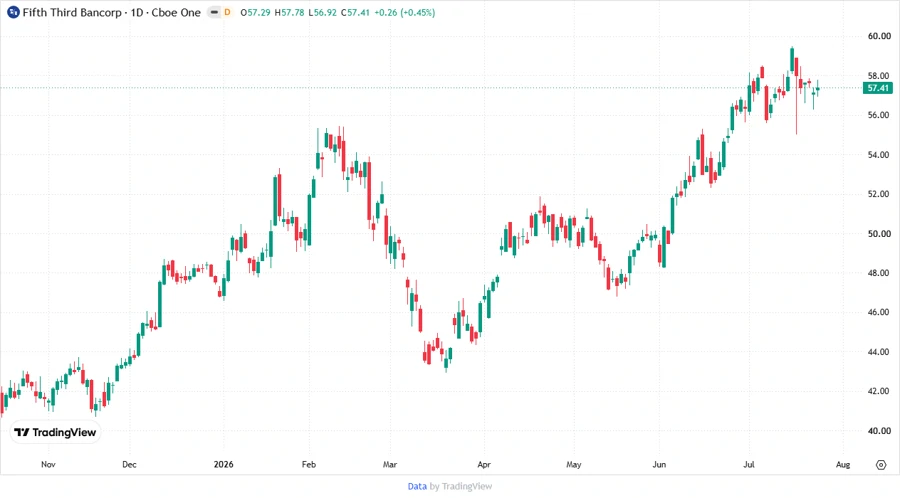
Price Development
🔍 Dividend Scoring System
| Criteria | Score | |
|---|---|---|
| Dividend Yield | 3 | |
| Dividend Stability | 5 | |
| Dividend Growth | 4 | |
| Payout Ratio | 3 | |
| Financial Stability | 4 | |
| Dividend Continuity | 5 | |
| Cashflow Coverage | 4 | |
| Balance Sheet Quality | 3 |
Overall Score: 31/40 🏆
🌟 Rating
Fifth Third Bancorp maintains a compelling dividend profile with consistent growth, stability, and a favorable yield. Although the payout ratio warrants attention, the overall financial health and operational success offer confidence in sustained dividend payments. We recommend viewing Fifth Third Bancorp as a dependable income investment within a diversified portfolio. ✅
Smart Data Insight
Master the Perfect Entry & Exit for this Stock
Don't leave your profits to chance. Historically, this stock follows specific seasonal patterns that institutional traders use to maximize returns.
- ✅ Identify the "Golden Buying Window"
- ✅ Avoid high-risk correction cycles
- ✅ Backtested data from the last 20+ years