July 22, 2025 a 07:31 am


FITB: Dividend Analysis - Fifth Third Bancorp
Fifth Third Bancorp offers an attractive dividend profile with a solid yield and a history of steady growth. As a financial institution with a robust track record, its dividends are supported by healthy cash flows and prudent payout ratios, making it a potentially rewarding choice for income-focused investors. Despite slight fluctuations in the historical growth rate, its long-standing dividend payment history over 42 years underscores its commitment to returning capital to shareholders.
📊 Overview
Fifth Third Bancorp operates within the financial sector, characterized by its strong dividend yield and consistent payouts. The bank's ability to maintain its dividend, despite economic fluctuations, reflects its stable financial health and strategy to enhance shareholder value.
| Metric | Value |
|---|---|
| Sector | Financial |
| Dividend yield | 3.60 % |
| Current dividend per share | 1.72 USD |
| Dividend history | 42 years |
| Last cut or suspension | None |
🗣️ Dividend History
The extensive dividend history of Fifth Third Bancorp highlights its commitment to delivering consistent returns to shareholders. Such a track record, spanning over four decades, is indicative of a resilient dividend policy. Maintaining dividends even during economic downturns reinforces investor confidence.
| Year | Dividend per Share (USD) |
|---|---|
| 2025 | 0.74 |
| 2024 | 1.44 |
| 2023 | 1.36 |
| 2022 | 1.26 |
| 2021 | 1.14 |
📈 Dividend Growth
The growth of dividends over the years is a testament to Fifth Third Bancorp's strong financial performance and strategy to share profits with its investors. Growth rates over 3 and 5 years provide insight into the company's capability to enhance shareholder returns through increasing payments.
| Time | Growth |
|---|---|
| 3 years | 8.10 % |
| 5 years | 8.90 % |
The average dividend growth is 8.90 % over 5 years. This shows moderate but steady dividend growth.
📉 Payout Ratio
Payout ratios offer insight into the sustainability of a company's dividend. Fifth Third Bancorp maintains a balanced approach between earnings and free cash flow payout, ensuring future dividend capabilities.
| Key figure | Ratio |
|---|---|
| EPS-based | 49.50 % |
| Free cash flow-based | 36.05 % |
With an EPS-based payout ratio at 49.50 % and a FCF-based ratio at 36.05 %, Fifth Third Bancorp is well-positioned to sustain its dividends while retaining adequate capital for operations and growth investments.
✅ Cashflow & Capital Efficiency
Analyzing cash flow and capital efficiency metrics helps understand a company's operational cash generation capabilities and capital management strategies. These insights are crucial for evaluating the company's ability to continue reinvesting in growth while maintaining its cash flow health.
| Year | 2024 | 2023 | 2022 |
|---|---|---|---|
| Free Cash Flow Yield | 8.36 % | 16.92 % | 25.42 % |
| Earnings Yield | 8.02 % | 9.95 % | 10.83 % |
| CAPEX to Operating Cash Flow | 14.66 % | 11.44 % | 10.66 % |
| Stock-based Compensation to Revenue | 1.26 % | 1.37 % | 1.82 % |
| Free Cash Flow / Operating Cash Flow Ratio | 85.34 % | 88.56 % | 89.34 % |
| Return on Invested Capital | 5.07 % | 5.14 % | 5.59 % |
The cash flow metrics of Fifth Third Bancorp demonstrate effective capital allocation and sufficient free cash flow generation to support both growth and dividend payments.
📈 Balance Sheet & Leverage Analysis
A well-structured balance sheet indicates financial stability, which is crucial for managing leverage and liquidity. Fifth Third Bancorp's leverage ratios and liquidity measures offer a comprehensive view of its financial health and debt structure.
| Year | 2024 | 2023 | 2022 |
|---|---|---|---|
| Debt-to-Equity | 0.97 | 1.01 | 1.07 |
| Debt-to-Assets | 8.91 % | 9.06 % | 8.97 % |
| Debt-to-Capital | 49.13 % | 50.34 % | 51.78 % |
| Net Debt to EBITDA | 4.68 | 4.72 | 4.29 |
| Current Ratio | 0.38 | 0.47 | 0.41 |
| Quick Ratio | 0.38 | 0.47 | 0.41 |
| Financial Leverage | 10.84 | 11.19 | 11.97 |
Fifth Third Bancorp maintains moderate leverage ratios and solid liquidity, reflecting a balanced approach to debt management and operational fluidity.
📉 Fundamental Strength & Profitability
Profitability metrics are key indicators of a company's efficiency in generating profits from its assets and equity. Fifth Third Bancorp's robust profitability ratios highlight its operational strength and competitive position in the market.
| Year | 2024 | 2023 | 2022 |
|---|---|---|---|
| Return on Equity | 11.78 % | 12.25 % | 14.12 % |
| Return on Assets | 1.09 % | 1.09 % | 1.18 % |
| Net Profit Margin | 17.73 % | 19.01 % | 26.94 % |
| EBIT Margin | 22.35 % | 24.18 % | 34.06 % |
| EBITDA Margin | 26.14 % | 27.92 % | 38.87 % |
| Gross Margin | 59.18 % | 63.99 % | 83.03 % |
| Research & Development to Revenue | 0 % | 0 % | 0 % |
With strong return on equity and profit margins, Fifth Third Bancorp stands out as a profitable enterprise with the ability to generate substantial shareholder returns.
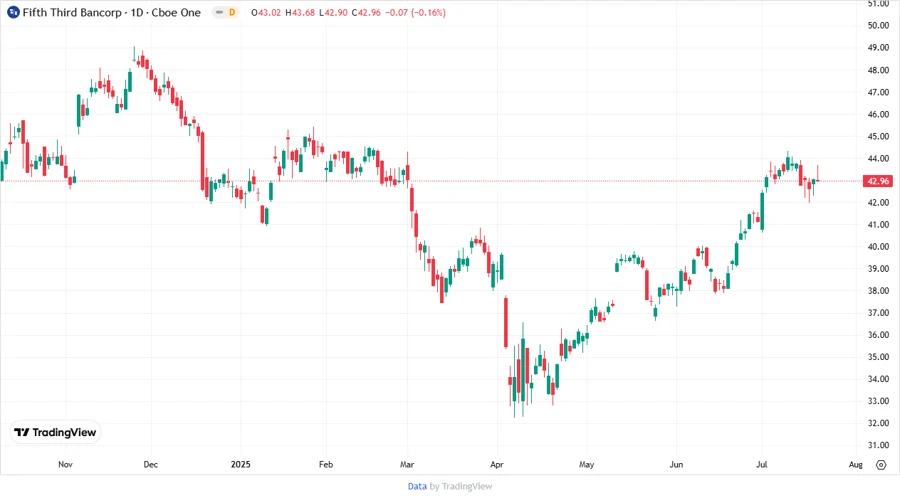
🗣️ Price Development
✅ Dividend Scoring System
| Criteria | Score | Bar |
|---|---|---|
| Dividend yield | 4 | |
| Dividend Stability | 5 | |
| Dividend growth | 4 | |
| Payout ratio | 4 | |
| Financial stability | 4 | |
| Dividend continuity | 5 | |
| Cashflow Coverage | 4 | |
| Balance Sheet Quality | 4 |
Total Score: 34/40
⚠️ Rating
Fifth Third Bancorp presents a compelling dividend investment opportunity with a strong yield, proven stability, and solid growth prospects. The firm's financial health supports its dividend strategy, making it an attractive choice for income-centric portfolios. However, investors should remain aware of market risks inherent in the banking sector.
Smart Data Insight
Master the Perfect Entry & Exit for this Stock
Don't leave your profits to chance. Historically, this stock follows specific seasonal patterns that institutional traders use to maximize returns.
- ✅ Identify the "Golden Buying Window"
- ✅ Avoid high-risk correction cycles
- ✅ Backtested data from the last 20+ years