June 20, 2025 a 11:31 am

FITB: Dividend Analysis - Fifth Third Bancorp
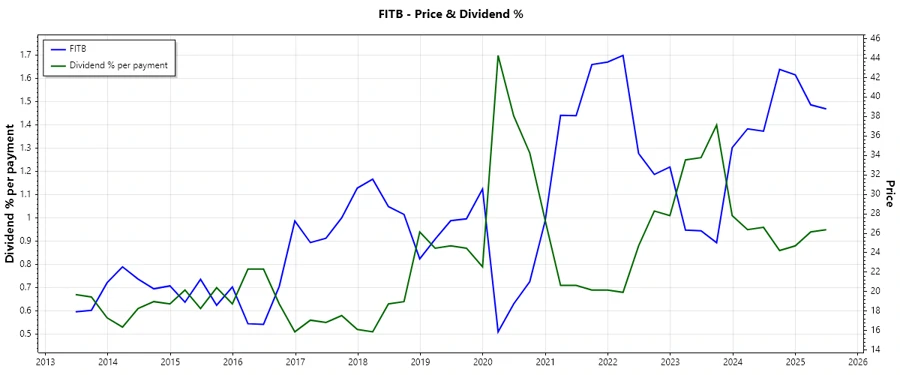
Fifth Third Bancorp demonstrates a robust commitment to its shareholders with a strong dividend yield of 3.82% and an impressive 42-year history of undeviating dividend distribution. Despite a challenging market environment, the absence of recent dividend cuts or suspensions highlights its resilience. With steady dividend growth and prudent payout ratios, Fifth Third Bancorp remains an attractive option for income-focused investors.
Overview 📊
Fifth Third Bancorp operates in a competitive sector, yet maintains a solid dividend profile reflecting its financial health and shareholder commitment.
| Metric | Value |
|---|---|
| Sector | Financials |
| Dividend yield | 3.82% |
| Current dividend per share | 1.72 USD |
| Dividend history | 42 years |
| Last cut or suspension | None |
Dividend History 📉
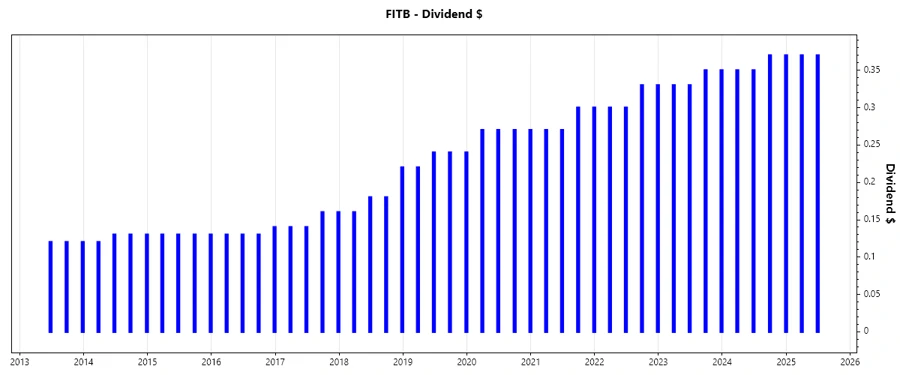
A 42-year dividend history underscores Fifth Third Bancorp's steadfast commitment to returning capital to its shareholders. Such a track record is pivotal for investor confidence, showcasing a trajectory of shareholder value creation.
| Year | Dividend per Share (USD) |
|---|---|
| 2025 | 0.74 |
| 2024 | 1.44 |
| 2023 | 1.36 |
| 2022 | 1.26 |
| 2021 | 1.14 |
Dividend Growth 📈
The dividend growth rate illustrates the company's potential for enhancing shareholder returns, reflecting its income-generating capacity and managerial efficiency.
| Time | Growth |
|---|---|
| 3 years | 8.10% |
| 5 years | 8.90% |
The average dividend growth is 8.90% over 5 years. This shows moderate but steady dividend growth.
Payout Ratio ⚠️
The payout ratio is crucial to assess the sustainability of dividend payments. A balanced ratio indicates that the company efficiently manages its earnings and cash flow to sustain or potentially increase dividends.
| Key figure | Ratio |
|---|---|
| EPS-based | 50.10% |
| Free cash flow-based | 36.05% |
The EPS payout ratio of 50.10% and FCF payout ratio of 36.05% suggest a healthy coverage, ensuring sustainability of dividend payments without over-leveraging earnings and cash flow.
Cashflow & Capital Efficiency ✅
A company's cash flow and capital efficiency determine its ability to sustain operations, invest in future growth, and meet financial obligations.
| Metric | 2024 | 2023 | 2022 |
|---|---|---|---|
| Free Cash Flow Yield | 8.36% | 16.92% | 25.42% |
| Earnings Yield | 8.02% | 9.95% | 10.83% |
| CAPEX to Operating Cash Flow | 14.66% | 11.44% | 10.66% |
| Stock-based Compensation to Revenue | 1.26% | 1.37% | 1.82% |
| Free Cash Flow / Operating Cash Flow Ratio | 85.34% | 88.56% | 89.34% |
The solid free cash flow yield and balanced CAPEX reflect efficient capital handling, supporting operations and strategic initiatives while enhancing shareholder returns.
Balance Sheet & Leverage Analysis 🏦
A company's leverage and financial ratios gauge its financial stability and risk, impacting funding costs and liquidity.
| Metric | 2024 | 2023 | 2022 |
|---|---|---|---|
| Debt-to-Equity | 0.97 | 1.01 | 1.07 |
| Debt-to-Assets | 0.09 | 0.09 | 0.09 |
| Debt-to-Capital | 0.49 | 0.50 | 0.52 |
| Net Debt to EBITDA | 4.68 | 4.72 | 4.29 |
| Current Ratio | 0.35 | 0.47 | 0.41 |
| Quick Ratio | 0.38 | 0.47 | 0.41 |
| Financial Leverage | 10.84 | 11.19 | 11.97 |
The firm's leverage indicates prudent capital management, with a balanced debt structure promoting operational and financial flexibility.
Fundamental Strength & Profitability 🏆
Understanding profitability and margin trends is crucial to assess operational efficiency and overall financial health.
| Metric | 2024 | 2023 | 2022 |
|---|---|---|---|
| Return on Equity | 11.78% | 12.25% | 14.12% |
| Return on Assets | 1.09% | 1.09% | 1.18% |
| Net Margin | 17.73% | 19.01% | 26.94% |
| EBIT Margin | 22.35% | 24.18% | 34.06% |
| EBITDA Margin | 26.14% | 27.92% | 38.87% |
| Gross Margin | 59.18% | 63.99% | 83.03% |
| Research & Development to Revenue | 0.00% | 0.00% | 0.00% |
The impressive profitability metrics underscore efficient resource allocation and cost management, ensuring sustained strategic advantage.
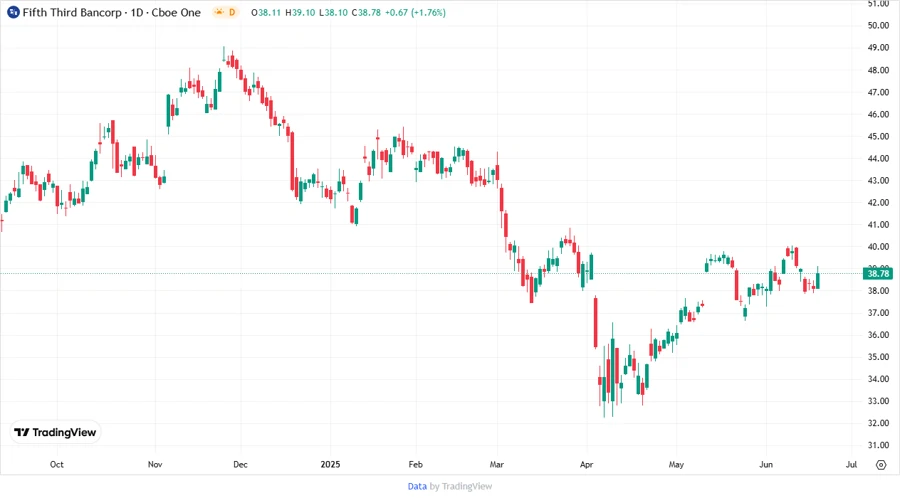
Price Development 🗣️
Dividend Scoring System 🔍
| Category | Score | Score Bar |
|---|---|---|
| Dividend yield | 4 | |
| Dividend Stability | 5 | |
| Dividend growth | 4 | |
| Payout ratio | 4 | |
| Financial stability | 4 | |
| Dividend continuity | 5 | |
| Cashflow Coverage | 4 | |
| Balance Sheet Quality | 4 |
Total Score: 34/40
Rating ⭐
Fifth Third Bancorp, with its strong dividend profile, steady growth, and balanced financial metrics, presents a compelling opportunity for dividend-oriented investors seeking stability and moderate growth. The company's resilient financial foundation and efficient capital allocation suggest continued shareholder value creation, justifying a positive investment outlook.
Smart Data Insight
Master the Perfect Entry & Exit for this Stock
Don't leave your profits to chance. Historically, this stock follows specific seasonal patterns that institutional traders use to maximize returns.
- ✅ Identify the "Golden Buying Window"
- ✅ Avoid high-risk correction cycles
- ✅ Backtested data from the last 20+ years