April 09, 2026 a 04:03 am
FIS: Trend and Support & Resistance Analysis - Fidelity National Information Services, Inc.
Fidelity National Information Services, Inc. (FIS) operates in a technology-driven environment providing solutions for merchants, banks, and capital market firms. Recent stock data analysis shows varied price movement, indicating periods of both upward momentum and potential resistance. This analysis aims to shed light on current trends and identify key support and resistance levels that may influence future price action.
Trend Analysis
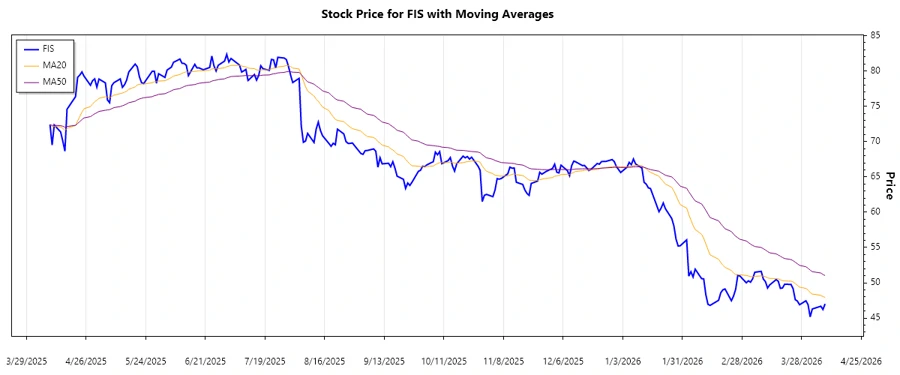
Through the analysis of recent closing prices of FIS stock, the short-term exponential moving average (EMA20) is calculated as approximately 51.47 and the longer-term EMA50 as approximately 55.22, suggesting a predominant downtrend as indicated by EMA20 being lower than EMA50. This reflects a bearish sentiment in the market in the observed period.
| Date | Closing Price | Trend |
|---|---|---|
| 2026-04-08 | 47.01 | ▼ |
| 2026-04-07 | 46.21 | ▼ |
| 2026-04-06 | 46.68 | ▼ |
| 2026-04-02 | 46.29 | ▼ |
| 2026-04-01 | 45.17 | ▼ |
| 2026-03-31 | 46.91 | ▼ |
| 2026-03-30 | 47.45 | ▼ |
Technically, the persistence of the bearish cross suggests that traders might consider further downside pressure unless the price convincingly breaks above the EMA50.
Support and Resistance
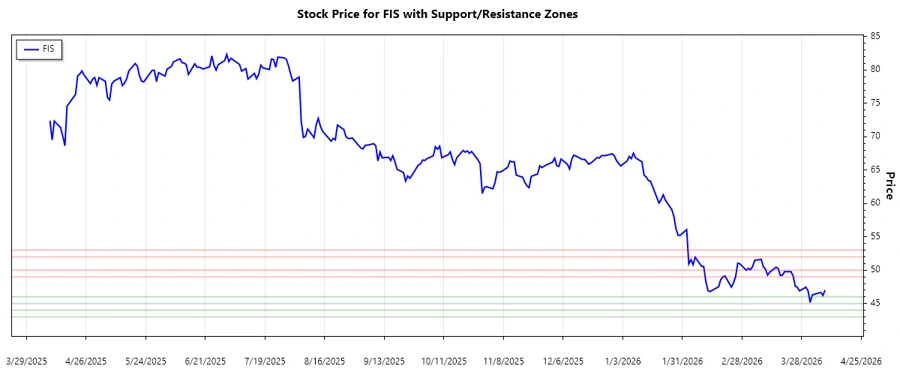
Analysis of the recent closing prices identifies critical support and resistance zones. These levels are observed as focal points of probable price reversal or continuation.
| Zone | Price Range |
|---|---|
| Support 1 | 45.00 ⬆️ - 46.00 ⬆️ |
| Support 2 | 43.00 ⬆️ - 44.00 ⬆️ |
| Resistance 1 | 49.00 ⬇️ - 50.00 ⬇️ |
| Resistance 2 | 52.00 ⬇️ - 53.00 ⬇️ |
The current trading level is nestled within the lower support zone, suggesting that further declines could be cushioned before a rebound. Conversely, any upward moves will likely face resistance around the 49 to 50 zone.
Conclusion
The technical outlook for FIS suggests caution. The prevailing downtrend is likely to persist without a significant upward movement past critical resistance. The stock is currently trading in a lower support area, which could provide some stabilization. However, if tested support fails, further decline could be expected. Conversely, any substantial market improvement could propel the stock towards resistance zones, offering bullish recovery potential. Traders and investors should watch for breakouts at these levels to gauge future price actions.