February 09, 2026 a 03:15 am
FIS: Trend and Support & Resistance Analysis - Fidelity National Information Services, Inc.
Fidelity National Information Services, Inc. (FIS) operates extensively in the technology sector, providing crucial solutions for merchants, banks, and capital markets globally. The historical price data shows a recent decline in FIS's stock price, with potential signs of stabilization. The analysis of support and resistance levels indicates crucial zones that could determine FIS's near-term movement.
Trend Analysis
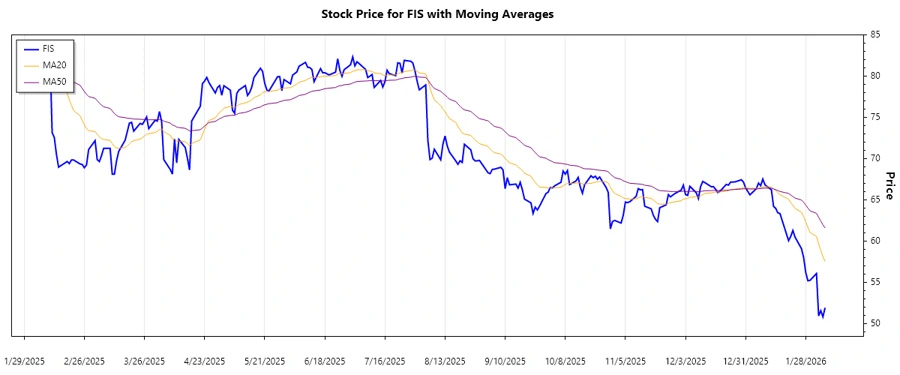
The recent historical data indicates a significant decline in the price of FIS shares, which has transitioned from a long-established uptrend to a noticeable downtrend. Using the exponential moving averages (EMA), we see EMA20 (63.61) is less than EMA50 (68.80), reinforcing a current ▼ Abwärtstrend. This indicates sustained bearishness, with prices hovering well below key EMAs.
| Date | Close Price | Trend |
|---|---|---|
| 2026-02-06 | $51.93 | ▼ |
| 2026-02-05 | $50.82 | ▼ |
| 2026-02-04 | $51.57 | ▼ |
| 2026-02-03 | $50.94 | ▼ |
| 2026-02-02 | $56.08 | ▲ |
| 2026-01-30 | $55.25 | ▲ |
| 2026-01-29 | $55.20 | ▲ |
The downward trajectory suggests continued bearish potential unless a catalyst prompts a reversal. The crossovers of short-term EMA below long-term EMA particularly strengthen the bearish sentiment.
Support and Resistance
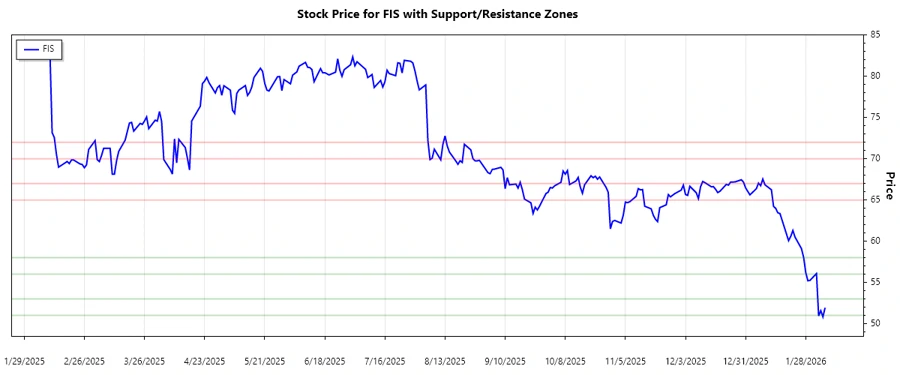
The analysis of the price pattern reveals critical support and resistance zones that help in assessing entry and exit points for FIS. Notably, the support levels are observed around $51 to $53 and $56 to $58, while resistance is established from $65 to $67 and $70 to $72.
| Zone Type | Zone Start | Zone End | Zone Direction |
|---|---|---|---|
| Support | $51.00 | $53.00 | ▲ |
| Support | $56.00 | $58.00 | ▲ |
| Resistance | $65.00 | $67.00 | ▼ |
| Resistance | $70.00 | $72.00 | ▼ |
Currently, the price is below the primary support level, suggesting possible further declines unless there is a significant upward shift in momentum.
Conclusion
Fidelity National Information Services, Inc. (FIS) is facing strong bearish pressure, as indicated by current trend and support/resistance analysis. The dominance of the downward trend requires careful consideration for potential investors or traders. Momentum indicators currently favor bear movements, and strategic positions should be monitored for any breakout or reversal patterns. Watch closely for changes in EMA alignment that could signal renewed bullish activity. Risk outweighs the opportunity unless a substantial shift in market conditions occurs, or news acts as a potential catalyst for change.