October 17, 2025 a 11:45 am
FIS: Fibonacci Analysis - Fidelity National Information Services, Inc.
Fidelity National Information Services, Inc. (FIS) has experienced a significant downtrend over the past few months. The company's diverse services in technology solutions for financial entities make it a vital player in its industry. However, recent market movements hint at challenges faced in maintaining higher stock valuations. This analysis will delve into the technical aspects and potential retracement levels to provide investors with crucial insights.
Fibonacci Analysis
| Detail | Information |
|---|---|
| Trend Period | 2024-10-17 to 2025-10-16 |
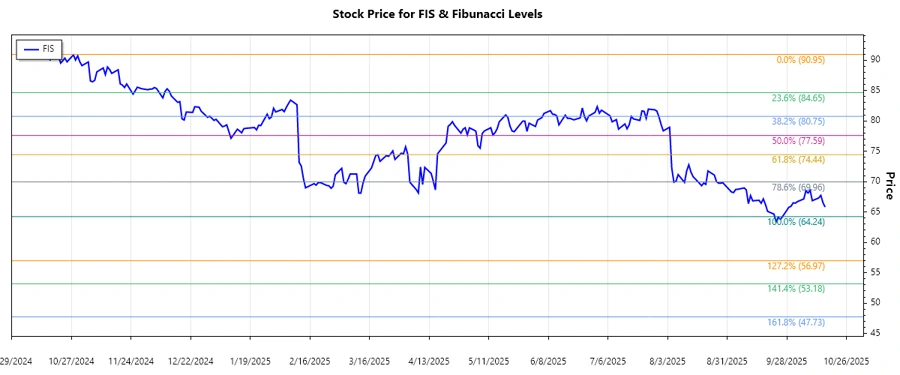
| High Point (Price/Date) | $90.95 on 2024-10-18 |
| Low Point (Price/Date) | $64.24 on 2025-09-26 |
Fibonacci Retracement Levels
| Level | Price |
|---|---|
| 0.236 | $70.85 |
| 0.382 | $74.40 |
| 0.500 | $77.60 |
| 0.618 | $80.79 |
| 0.786 | $85.20 |
The current price of FIS is $65.81, indicating it is not currently within a Fibonacci retracement zone, suggesting potential downside or continued consolidation.
This could imply that the previous support levels might become resistance, posing a challenge in achieving higher valuations in the short term.
Conclusion
The stock price of FIS is navigating a substantial downturn, highlighted by the inability to breach key retracement levels. The possible support turn resistance at higher stock valuations suggests a cautious approach for prospective investors. However, this environment might offer opportunity for long-term investment given FIS's established presence and varied services catering to financial markets. Analysts should closely monitor market conditions and any strategic company moves, as these could inform notable shifts in stock performance.
Smart Data Insight
Master the Perfect Entry & Exit for this Stock
Don't leave your profits to chance. Historically, this stock follows specific seasonal patterns that institutional traders use to maximize returns.
- ✅ Identify the "Golden Buying Window"
- ✅ Avoid high-risk correction cycles
- ✅ Backtested data from the last 20+ years