September 02, 2025 a 05:15 am

FIS: Fibonacci Analysis - Fidelity National Information Services, Inc.
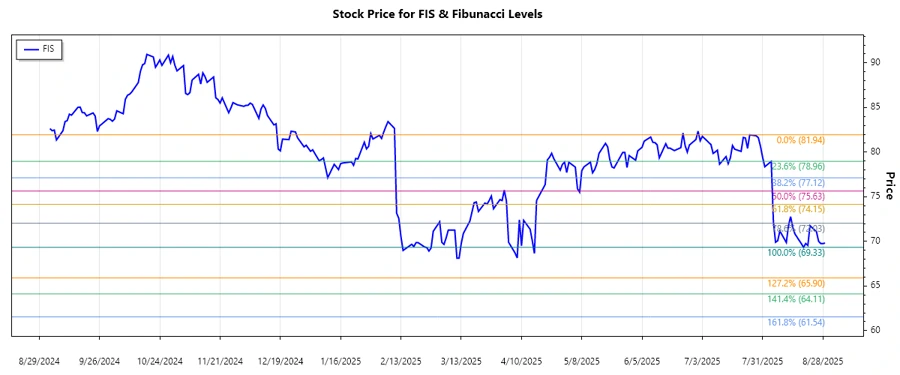
The stock of Fidelity National Information Services, Inc. has been on a downward trend recently, reflecting challenges in the technology solutions sector. Despite its broad range of services across different segments, FIS faces competitive pressure and economic headwinds which have been impacting its stock performance. This technical analysis aims to identify potential areas of support and resistance to assess future price movement.
Fibonacci Analysis
Based on the recent historical data, there has been a dominant downward trend in FIS stock price.
| Trend Information | Details |
|---|---|
| Start Date | 2025-05-07 |
| End Date | 2025-08-29 |
| High Price & Date | $81.94 on 2025-07-25 |
| Low Price & Date | $69.33 on 2025-08-19 |
Fibonacci Retracement Levels
| Level | Price |
|---|---|
| 0.236 | $73.56 |
| 0.382 | $74.96 |
| 0.5 | $76.14 |
| 0.618 | $77.32 |
| 0.786 | $79.07 |
As of the latest price data, FIS is trading at $69.81, below the 0.236 retracement level. The stock currently does not reside within any major Fibonacci retracement level zone, indicating a continuation of the bearish sentiment.
Conclusion
Fidelity National Information Services, Inc. has been experiencing downward pressure reflected in the stock's bearish trend. The current inability to break above Fibonacci retracement levels highlights potential resistance points that FIS may face in the near term. Analysts observe technical support below the recent low price which if broken might signal further declines. Vigilance is advised for investors as market conditions remain uncertain and competitive pressures persist. Opportunities arise in monitoring potential bounce-back scenarios at identified support levels.
Smart Data Insight
Master the Perfect Entry & Exit for this Stock
Don't leave your profits to chance. Historically, this stock follows specific seasonal patterns that institutional traders use to maximize returns.
- ✅ Identify the "Golden Buying Window"
- ✅ Avoid high-risk correction cycles
- ✅ Backtested data from the last 20+ years