
June 29, 2026 a 11:31 am

FIS: Dividend Analysis - Fidelity National Information Services, Inc.
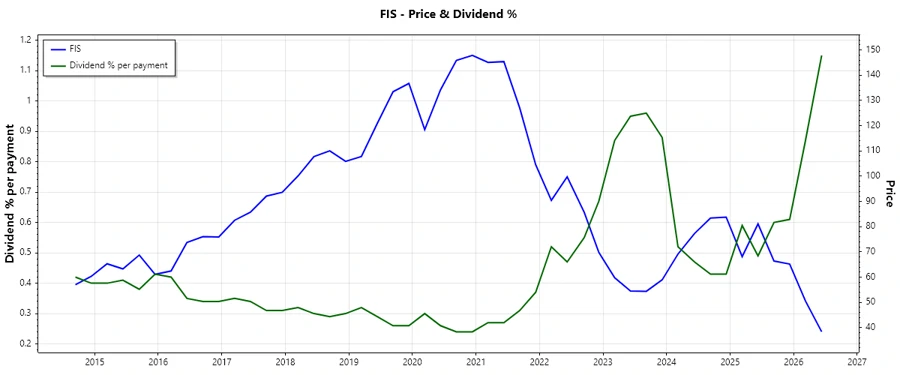
Fidelity National Information Services, Inc. (FIS) displays a robust commitment to its dividend payments, evidenced by a long dividend history spanning 24 years. Despite a moderate dividend yield of 4.38%, its substantial market capitalization and strategic financial management have fortified its position in the financial sector. Investors should take note of its remarkable dividend continuity, making it an appealing option for those seeking stable income generation.
📊 Overview
FIS operates within the financial services technology sector, offering comprehensive solutions to its clients. Its dividend yield of 4.38% signifies a healthy return for income-focused investors. With a current dividend of $1.64 per share, FIS demonstrates a consistent dividend payout strategy over 24 years of history without any recent cuts or suspensions, illustrating resilience in maintaining shareholder value.
| Sector | Dividend Yield | Current Dividend Per Share | Dividend History | Last Cut/Suspension |
|---|---|---|---|---|
| Financial Services Technology | 4.38% | $1.64 | 24 years | None |
📈 Dividend History
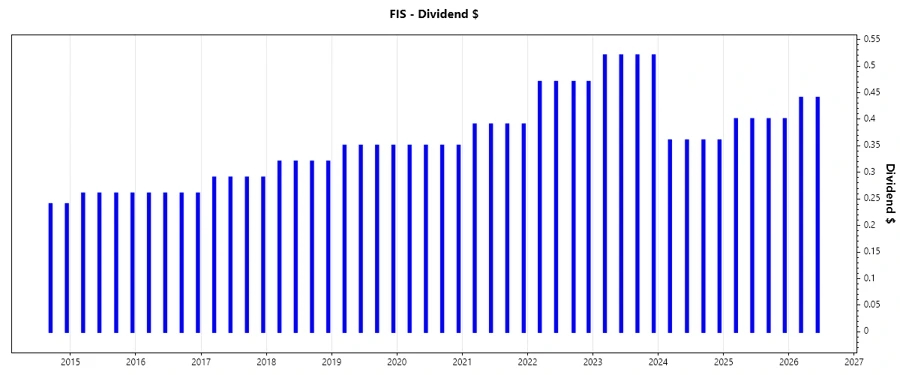
The dividend history of FIS reflects its dedication to consistent shareholder returns, maintaining and often increasing dividends over the years. This history is crucial as it reflects the company's commitment to rewarding investors, even amidst economic fluctuations.
| Year | Dividend per Share (USD) |
|---|---|
| 2026 | 0.88 |
| 2025 | 1.60 |
| 2024 | 1.44 |
| 2023 | 2.08 |
| 2022 | 1.88 |
📉 Dividend Growth
Analyzing dividend growth provides insight into the company’s capacity to increase payments over time. This reflects FIS's ability to generate profit and manage resources effectively.
| Time | Growth |
|---|---|
| 3 years | -5.23% |
| 5 years | 2.71% |
The average dividend growth is 2.71% over 5 years. This shows moderate but steady dividend growth.
✅ Payout Ratio
The payout ratio indicates what portion of earnings is distributed to shareholders as dividends. A lower ratio suggests ample room for future dividend increases, indicating financial health and stability.
| Key figure | Ratio |
|---|---|
| EPS-based | 31.59% |
| Free Cash Flow-based | 30.45% |
The EPS payout ratio of 31.59% and FCF payout ratio of 30.45% show a conservative dividend policy, leaving plenty of room for potential future growth in dividend payments.
Cashflow & Capital Efficiency
Cashflow evaluation is critical for understanding a company’s ability to sustain and potentially increase dividends. Analyzing capital efficiency metrics helps assess the robustness of cash generation against operational and capital expenditure demands.
| Measure | 2023 | 2024 | 2025 |
|---|---|---|---|
| Free Cash Flow Yield | 11.89% | 4.42% | 8.18% |
| Earnings Yield | -18.75% | 3.25% | 1.11% |
| CAPEX to Operating Cash Flow | 2.65% | 4.68% | 5.20% |
| Stock-based Compensation to Revenue | 1.22% | 1.84% | 1.70% |
| Free Cash Flow / Operating Cash Flow Ratio | 97.35% | 95.32% | 94.80% |
FIS displays solid capital efficiency and cashflow robustness, highlighting its capability to cover operating expenses and manage capital expenditures efficiently.
Balance Sheet & Leverage Analysis
A healthy balance sheet with manageable leverage ensures financial stability and the ability to weather economic downturns. These ratios are crucial indicators of long-term sustainability and liquidity strength.
| Metric | 2023 | 2024 | 2025 |
|---|---|---|---|
| Debt-to-Equity | 101.53% | 73.52% | 28.87% |
| Debt-to-Assets | 35.18% | 34.16% | 11.98% |
| Debt-to-Capital | 50.38% | 42.37% | 22.40% |
| Net Debt to EBITDA | 6.51x | 3.16x | 1.18x |
| Current Ratio | 0.75 | 0.85 | 0.59 |
| Quick Ratio | 0.75 | 0.85 | 0.59 |
| Financial Leverage | 2.89x | 2.15x | 2.41x |
The analysis reflects reduced leverage over time, enhancing financial stability and reducing risk exposure, ensuring a more favorable credit profile.
Fundamental Strength & Profitability
The fundamental performance indicates how effectively a company utilizes its resources to generate earnings and grow shareholder value. Key profitability metrics are imperative for long-term operational viability.
| Metric | 2023 | 2024 | 2025 |
|---|---|---|---|
| Return on Equity | -34.93% | 9.24% | 2.75% |
| Return on Assets | -12.11% | 4.29% | 1.14% |
| Net Margin | -67.69% | 14.32% | 3.58% |
| EBIT Margin | 13.99% | 16.27% | 9.53% |
| EBITDA Margin | 29.55% | 33.43% | 27.16% |
| Gross Margin | 37.19% | 37.56% | 36.86% |
| R&D to Revenue | 0% | 0% | 0% |
While profitability has recovered slightly over the recent years, there is room for improvement in margins and ROE, indicating potential areas for strategic focus and operational refinement.
🔍 Price Development
📊 Dividend Scoring System
| Category | Score | Indicator |
|---|---|---|
| Dividend yield | 3 | |
| Dividend Stability | 4 | |
| Dividend growth | 2 | |
| Payout ratio | 5 | |
| Financial stability | 4 | |
| Dividend continuity | 5 | |
| Cashflow Coverage | 4 | |
| Balance Sheet Quality | 3 |
Overall Score: 30/40
🗣️ Rating
FIS exhibits a strong dividend policy with substantial payouts and moderate dividend growth, making it an attractive option for conservative income-oriented investors. While certain profitability metrics suggest areas for improvement, its solid financial foundation and stable cash flow coverage reinforce a positive outlook for continuous dividend payments and shareholder value enhancement.
Smart Data Insight
Master the Perfect Entry & Exit for this Stock
Don't leave your profits to chance. Historically, this stock follows specific seasonal patterns that institutional traders use to maximize returns.
- ✅ Identify the "Golden Buying Window"
- ✅ Avoid high-risk correction cycles
- ✅ Backtested data from the last 20+ years