May 19, 2026 a 03:31 pm

FIS: Dividend Analysis - Fidelity National Information Services, Inc.
Fidelity National Information Services, Inc., known for its robust presence in the financial services sector, offers investors an attractive dividend yield of 3.79%. The company's consistent dividend history over 24 years is a testament to its commitment to shareholder returns. However, recent fluctuations in dividend growth warrant a closer examination of the underlying financial health.
Overview 📊
Fidelity National Information Services operates in the financial services sector, offering crucial technology solutions. Its current dividend yield stands at 3.79% with a dividend per share of $1.64. The company boasts a stable dividend history of 24 years with no recent cuts or suspensions, emphasizing its reliability as a dividend payer.
| Factor | Details |
|---|---|
| Sector | Financial Services |
| Dividend Yield | 3.79% |
| Current Dividend Per Share | $1.64 |
| Dividend History | 24 years |
| Last Cut or Suspension | None |
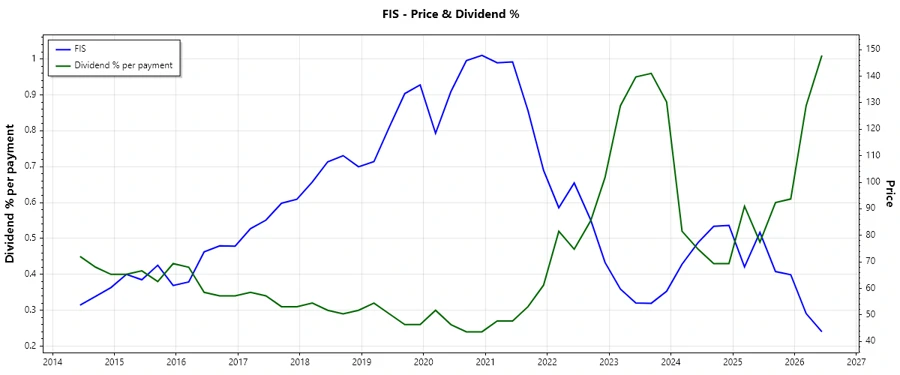
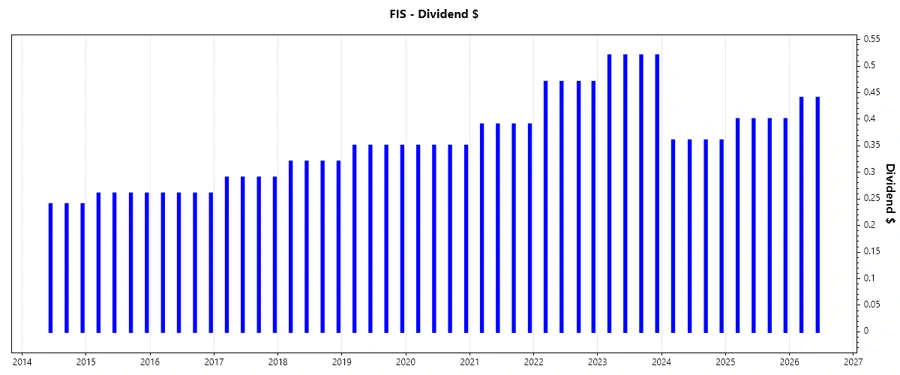
Dividend History 🗓️
The company's dividend payments over the years exhibit a pattern of reliability, crucial for investors relying on dividend income. Such a sustained history demonstrates strong corporate governance and cash flow management capabilities.
| Year | Dividend Per Share (USD) |
|---|---|
| 2026 | 0.88 |
| 2025 | 1.60 |
| 2024 | 1.44 |
| 2023 | 2.08 |
| 2022 | 1.88 |
Dividend Growth 📈
The assessment of dividend growth provides insight into the company's future payout potential and financial prospects. Moderate growth over five years indicates a stable progression, though recent declines pose questions about ongoing strategies.
| Time | Growth |
|---|---|
| 3 years | -5.23% |
| 5 years | 2.71% |
The average dividend growth is 2.71% over 5 years. This shows moderate but steady dividend growth.
Payout Ratio ✅
Analyzing payout ratios helps assess the sustainability of dividend payments. EPS and FCF payout ratios remain conservative, reinforcing confidence in financial management and future dividend preservation.
| Key Figure | Ratio |
|---|---|
| EPS-based | 31.59% |
| Free cash flow-based | 30.45% |
The payout ratios indicate prudent financial management, with an EPS ratio of 31.59% and a FCF ratio of 30.45%, suggesting potential room for future dividend increases.
Cashflow & Capital Efficiency 💸
Evaluating cash flow and capital efficiency metrics provides critical insights into operational performance and liquidity. Consistent free cash flow and capital efficiency ratios assure stakeholders of the company's robust financial health.
| Year | 2025 | 2024 | 2023 |
|---|---|---|---|
| Free Cash Flow Yield | 8.18% | 4.42% | 11.89% |
| Earnings Yield | 1.11% | 3.25% | -18.75% |
| CAPEX to Operating Cash Flow | 5.20% | 4.68% | 2.65% |
| Stock-based Compensation to Revenue | 1.70% | 1.84% | 1.22% |
| Free Cash Flow / Operating Cash Flow Ratio | 94.80% | 95.32% | 97.35% |
The company shows strong cash flow generation with high Free Cash Flow Yield, indicative of efficient financial operations and effective capital investment strategies.
Balance Sheet & Leverage Analysis 📉
An in-depth review of leverage metrics is crucial in determining long-term financial viability and risk assessment. FIS maintains moderate leverage, emphasizing a balanced approach to debt management.
| Year | 2025 | 2024 | 2023 |
|---|---|---|---|
| Debt-to-Equity | 0.29 | 0.74 | 1.02 |
| Debt-to-Assets | 0.12 | 0.34 | 0.35 |
| Debt-to-Capital | 0.22 | 0.42 | 0.50 |
| Net Debt to EBITDA | 1.18 | 3.16 | 6.51 |
| Current Ratio | 0.59 | 0.85 | 0.75 |
| Quick Ratio | 0.59 | 0.85 | 0.75 |
| Financial Leverage | 2.41 | 2.15 | 2.89 |
With a manageable debt profile, FIS demonstrates a balanced leverage approach that supports financial stability and positions it for potential growth opportunities.
Fundamental Strength & Profitability 💪
Key profitability metrics such as Return on Equity and Margins are essential indicators of management effectiveness and operational proficiency. FIS exhibits strong fundamental strength with consistent profitability ratios.
| Year | 2025 | 2024 | 2023 |
|---|---|---|---|
| Return on Equity | 2.75% | 9.24% | -34.93% |
| Return on Assets | 1.14% | 4.29% | -12.11% |
| Net Margin | 3.58% | 14.32% | -67.69% |
| EBIT Margin | 9.53% | 16.27% | 13.99% |
| EBITDA Margin | 27.16% | 33.42% | 29.55% |
| Gross Margin | 36.86% | 37.56% | 37.19% |
| R&D to Revenue | 0% | 0% | 0% |
The company's ongoing focus on profitability aligns well with its strategic objectives, delivering robust margins and returns that enhance shareholder value.
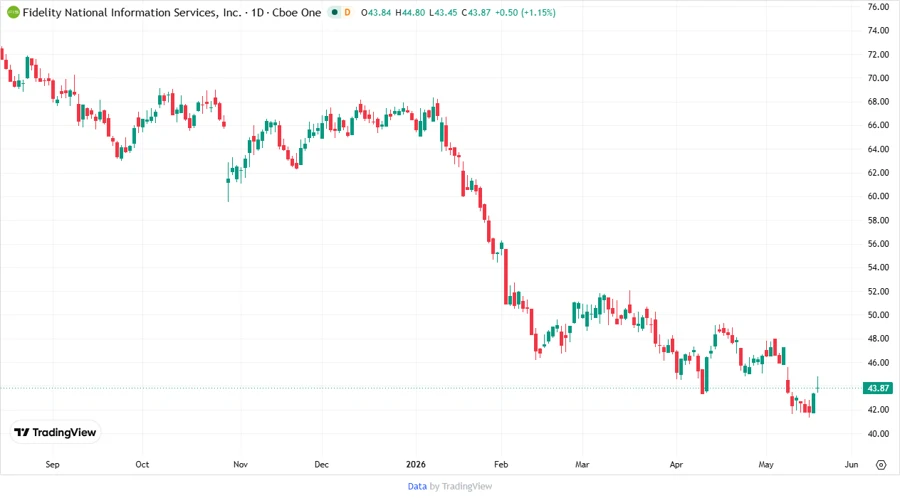
Price Development 🔍
Dividend Scoring System 🏆
| Criteria | Score | Visual Representation |
|---|---|---|
| Dividend Yield | 4 | |
| Dividend Stability | 5 | |
| Dividend Growth | 3 | |
| Payout Ratio | 5 | |
| Financial Stability | 4 | |
| Dividend Continuity | 5 | |
| Cashflow Coverage | 4 | |
| Balance Sheet Quality | 4 |
Total Score: 34/40
Rating 🏅
FIS offers a comprehensive dividend package characterized by stability and moderate growth. Despite recent challenges in dividend growth, the firm’s solid financial foundation and commitment to shareholders make it a worthwhile consideration for dividend-focused portfolios.
Smart Data Insight
Master the Perfect Entry & Exit for this Stock
Don't leave your profits to chance. Historically, this stock follows specific seasonal patterns that institutional traders use to maximize returns.
- ✅ Identify the "Golden Buying Window"
- ✅ Avoid high-risk correction cycles
- ✅ Backtested data from the last 20+ years