
April 25, 2026 a 12:46 pm

FIS: Dividend Analysis - Fidelity National Information Services, Inc.
Fidelity National Information Services, Inc. (FIS) presents a mixed but intriguing dividend profile, offering a competitive yield albeit with a historical reliance on high payout ratios. The company's recent dividend growth trajectory has been modest, indicative of potential stability in shareholder returns. However, potential investors should remain cautious regarding the sustainability of earnings in relation to dividend costs.
📊 Overview
Fidelity National Information Services operates within the financial sector, providing a consistent dividend yield which currently stands at 3.25%. Despite a notable history of 24 consecutive years without a dividend cut or suspension, the payout sustainability raises questions due to its relatively high EPS payout ratio.
| Metric | Data |
|---|---|
| Sector | Financial |
| Dividend yield | 3.25% |
| Current dividend per share | 1.638 USD |
| Dividend history | 24 years |
| Last cut or suspension | None |
🔍 Dividend History
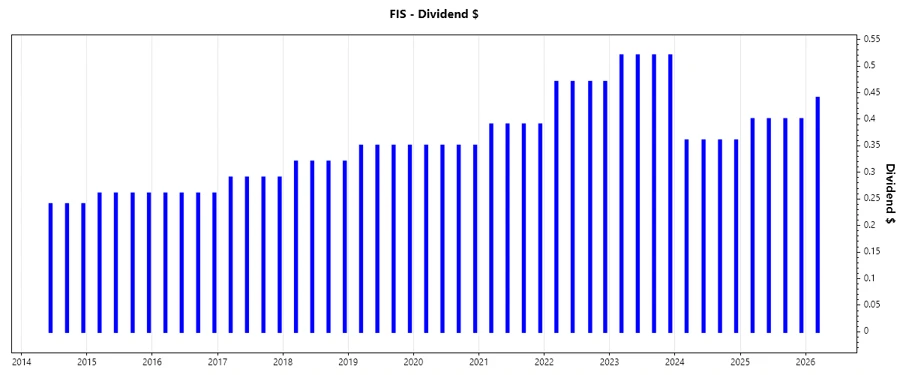
Analyzing FIS's dividend history reveals its commitments to shareholder returns over the past decades, with minor fluctuations indicating potential areas of concern that warrant close investor monitoring.
| Year | Dividend per share (USD) |
|---|---|
| 2026 | 0.44 |
| 2025 | 1.6 |
| 2024 | 1.44 |
| 2023 | 2.08 |
| 2022 | 1.88 |
🔼 Dividend Growth
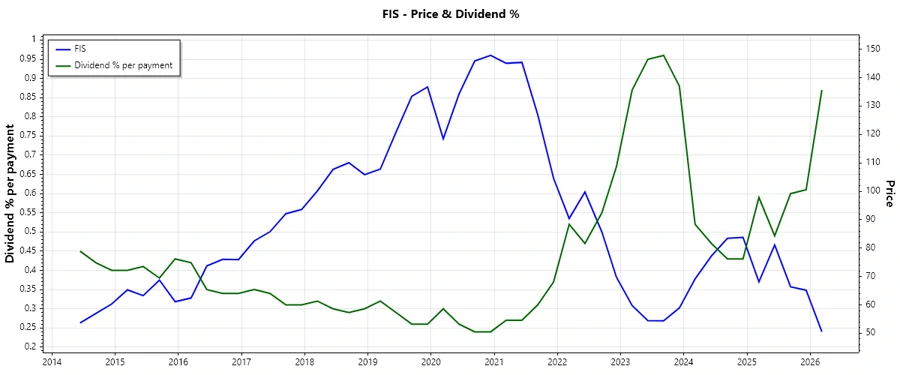
The dividend growth of FIS indicates a negative trend over the last 3 years with a slight upward adjustment over 5 years. This growth pattern elucidates a period of stagnation, potentially attributed to market or operational challenges.
| Time | Growth |
|---|---|
| 3 years | -5.23% |
| 5 years | 2.71% |
The average dividend growth is 2.71% over 5 years. This shows moderate but steady dividend growth, signaling some level of commitment to increasing shareholder returns in the long term.
💡 Payout Ratio
The payout ratios are crucial for understanding the financial obligation of dividends against the company's earnings and cash generation. FIS displays a concerningly high EPS-based payout ratio, suggesting a heavy reliance on earnings to fund dividends.
| Key figure ratio | Value |
|---|---|
| EPS-based | 221.73% |
| Free cash flow-based | 30.20% |
Given the exceptionally high EPS payout ratio of 221.73%, investors should view this with caution. The more moderate FCF payout ratio of 30.20% indicates sufficient cash flow coverage, mitigating some of the EPS concerns.
💸 Cashflow & Capital Efficiency
Examining the cash flow dynamics offers a window into FIS's operational efficiency and its ability to cover dividends. Adequate free cash flow yield and capital expenditure management underscore the firm’s operational soundness.
| Metric | 2023 | 2024 | 2025 |
|---|---|---|---|
| Free Cash Flow Yield | 11.89% | 4.42% | 8.18% |
| Earnings Yield | -18.75% | 3.25% | 1.11% |
| CAPEX to Operating CF | 2.65% | 4.68% | 5.20% |
| Stock-based Comp. to Revenue | 1.22% | 1.83% | 1.70% |
| Free CF / Operating CF Ratio | 97.35% | 95.32% | 94.80% |
The data indicates robust cash flow levels in line with operating activities, suggesting effective capital allocation strategies.
🛡️ Balance Sheet & Leverage Analysis
A comprehensive examination of the balance sheet metrics relative to leverage underscores the financial stability and creditworthiness of FIS. Ratios such as Debt-to-Equity and Liquidity ratios are fundamental in assessing risk exposure.
| Metric | 2023 | 2024 | 2025 |
|---|---|---|---|
| Debt-to-Equity | 101.53% | 73.52% | 28.87% |
| Debt-to-Assets | 35.18% | 34.16% | 11.98% |
| Debt-to-Capital | 50.38% | 42.37% | 22.40% |
| Net Debt to EBITDA | 6.51 | 3.16 | 1.18 |
| Current Ratio | 0.75 | 0.85 | 0.59 |
| Quick Ratio | 0.75 | 0.85 | 0.59 |
| Financial Leverage | 2.89 | 2.15 | 2.41 |
FIS shows a significant reduction in debt reliance from 2023 to 2025, implying positive financial maneuvering for risk reduction and improved liquidity.
📈 Fundamental Strength & Profitability
By evaluating core profitability metrics, we ascertain FIS's return on capital and its profit margins. These elements are crucial for assessing the firm's economic moat and future growth prospects.
| Metric | 2023 | 2024 | 2025 |
|---|---|---|---|
| Return on Equity | -34.93% | 9.24% | 2.75% |
| Return on Assets | -12.11% | 4.29% | 1.14% |
| Net Margin | -67.69% | 14.32% | 3.58% |
| EBIT Margin | 13.99% | 16.27% | 9.53% |
| EBITDA Margin | 29.55% | 33.43% | 27.16% |
| Gross Margin | 37.19% | 37.56% | 36.86% |
| R&D to Revenue | 0.00% | 0.00% | 0.00% |
Despite notable challenges, FIS has maintained competitive margins and shows an upward trajectory in profitability, albeit at modest levels.
🖼️ Price Development
🔍 Dividend Scoring System
| Criteria | Score | Score Bar |
|---|---|---|
| Dividend yield | 4 | |
| Dividend Stability | 3 | |
| Dividend Growth | 2 | |
| Payout ratio | 2 | |
| Financial Stability | 3 | |
| Dividend Continuity | 4 | |
| Cashflow Coverage | 4 | |
| Balance Sheet Quality | 3 |
Total Score: 25/40
🔎 Rating
Overall, FIS presents a complex dividend narrative with compelling yield yet disruptive payout ratios. Investors seeking stability might be drawn to the historical continuity and robust cash flow coverage but should weigh this against the high EPS dependence. A balanced approach could involve monitoring both macroeconomic indicators and internal performance metrics to effectively gauge long-term sustainability.
Smart Data Insight
Master the Perfect Entry & Exit for this Stock
Don't leave your profits to chance. Historically, this stock follows specific seasonal patterns that institutional traders use to maximize returns.
- ✅ Identify the "Golden Buying Window"
- ✅ Avoid high-risk correction cycles
- ✅ Backtested data from the last 20+ years