
July 14, 2026 a 01:15 pm**FICO: Trend and Support & Resistance Analysis - Fair Isaac Corporation**

Fair Isaac Corporation provides crucial analytic solutions across the globe, enhancing corporate decision-making processes. Over recent months, FICO's stock has displayed significant volatility but trends indicate potential stabilization. Understanding these market behaviors can aid investors in optimizing their portfolios. The following analysis provides key insights into recent trends and potential support and resistance levels.
Trend Analysis
The recent historical price movement indicates a noticeable trend changeover. Calculating the 20-day EMA and 50-day EMA provides insight into market direction:
| Date | Closing Price | Trend |
|---|---|---|
| 2026-07-13 | $1278.25 | ▲ |
| 2026-07-10 | $1250.9 | ▼ |
| 2026-07-09 | $1279.41 | ▲ |
| 2026-07-08 | $1266.08 | ▼ |
| 2026-07-07 | $1300.27 | ▲ |
| 2026-07-06 | $1286.51 | ▲ |
| 2026-07-02 | $1270.83 | ▼ |
EMA analysis suggests an uptrend as EMA20 is currently above EMA50. Therefore, this indicates a bullish movement with positive momentum.
Support and Resistance
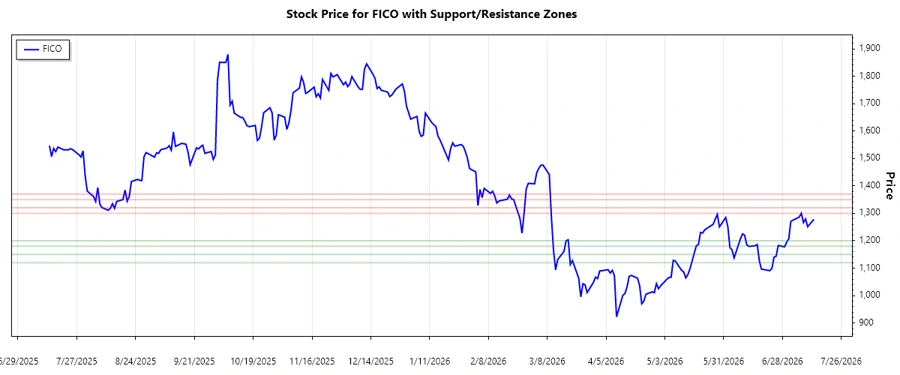
Assessing the recent closing prices, the following support and resistance zones have been identified:
| Zone Type | From | To |
|---|---|---|
| Support ↘️ | $1180 | $1200 |
| Support ↘️ | $1120 | $1150 |
| Resistance ↗️ | $1300 | $1320 |
| Resistance ↗️ | $1350 | $1370 |
Currently, the stock price is approaching the resistance zone of $1300 to $1320, indicating possible selling pressure. Traders should consider this resistance as a potential reversal point.
Conclusion
FICO has exhibited a predominantly bullish trend, supported by improving EMA indicators. The movement towards resistance zones could define immediate price actions. Strong support levels are established, providing a safety net for any retracement. However, caution is advised as resistance levels are approached, and there may be fluctuations. The strategic implications of these figures suggest a continued bullish outlook, but potential setbacks could present buy-the-dip opportunities if approached methodically.
Smart Data Insight
Master the Perfect Entry & Exit for this Stock
Don't leave your profits to chance. Historically, this stock follows specific seasonal patterns that institutional traders use to maximize returns.
- ✅ Identify the "Golden Buying Window"
- ✅ Avoid high-risk correction cycles
- ✅ Backtested data from the last 20+ years