
May 26, 2026 a 03:43 pm
FICO: Fundamental Ratio Analysis - Fair Isaac Corporation
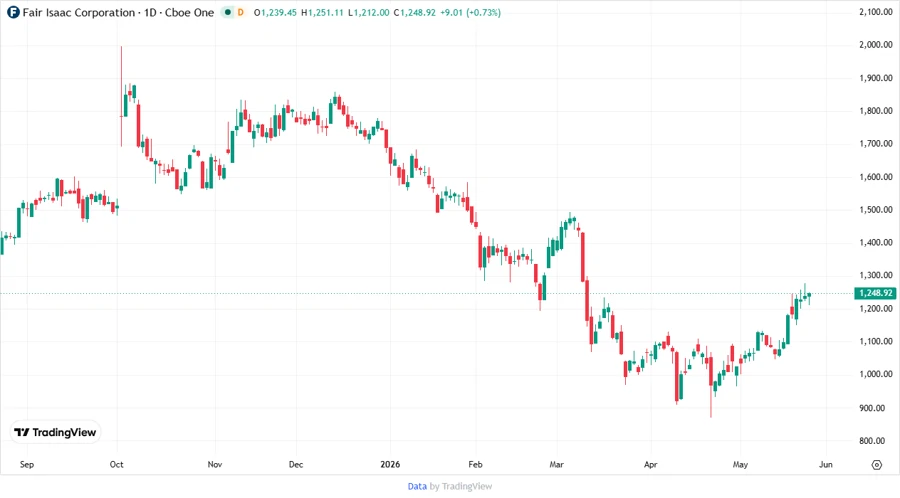
Fair Isaac Corporation, with its pioneering analytics and decision management solutions, has established itself as a crucial player in the tech industry. Despite facing competitive pressures, its diversified offerings in scores and software provide a resilient revenue stream. Investors should keep a close watch on its ability to innovate and maintain market leadership.
Fundamental Ratings
Overall, the fundamental ratings for Fair Isaac Corporation display a mix of strengths and weaknesses, with particular challenges in return metrics.
| Category | Score | Visualization |
|---|---|---|
| Discounted Cash Flow | 3 | |
| Return on Equity | 1 | |
| Return on Assets | 5 | |
| Debt to Equity | 1 | |
| Price to Earnings | 2 | |
| Price to Book | 1 |
Historical Ratings
The historical data suggests stable ratings with slight improvements over time.
| Date | Overall | DCF | ROE | ROA | Debt/Equity | P/E | P/B |
|---|---|---|---|---|---|---|---|
| 2026-05-22 | 2 | 3 | 1 | 5 | 1 | 2 | 1 |
| Historical | 0 | 3 | 1 | 5 | 1 | 2 | 1 |
Analyst Price Targets
Analyst consensus suggests potential for growth, with prices ranging significantly, indicating high volatility.
| High | Low | Median | Consensus |
|---|---|---|---|
| 1950 | 1150 | 1650 | 1593.56 |
Analyst Sentiment
The market sentiment leans towards a buying proposition, reflecting confidence in strategic initiatives.
| Recommendation | Count | Visualization |
|---|---|---|
| Strong Buy | 0 | |
| Buy | 16 | |
| Hold | 3 | |
| Sell | 0 | |
| Strong Sell | 0 |
Conclusion
Fair Isaac Corporation demonstrates a solid foundation with promising future potential, supported by innovative products and a strong market presence. However, attention must be given to financial ratios, particularly return metrics, which signal areas for improvement. The current analyst sentiment and target prices suggest a positive outlook, though volatility remains a concern. Prospective investors should balance optimism with cautious evaluation of competitive dynamics. The company's continued investment in technology and analytics is a positive sign for long-term growth.
Smart Data Insight
Master the Perfect Entry & Exit for this Stock
Don't leave your profits to chance. Historically, this stock follows specific seasonal patterns that institutional traders use to maximize returns.
- ✅ Identify the "Golden Buying Window"
- ✅ Avoid high-risk correction cycles
- ✅ Backtested data from the last 20+ years