April 06, 2026 a 04:44 pm
FICO: Fibonacci Analysis - Fair Isaac Corporation
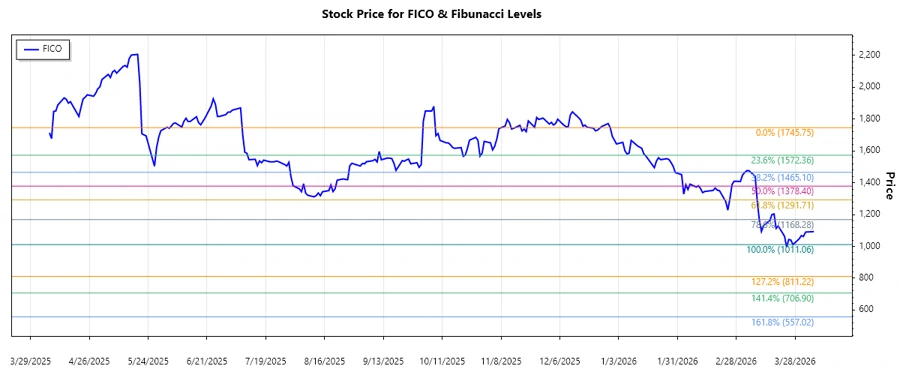
The Fair Isaac Corporation (FICO) stock demonstrates a dynamic movement driven by its dual business models in Scores and Software segments. As a prominent player in analytics and automated decision-making services, FICO's stock price can be sensitive to technological advancements and market demand fluctuations. Recently, the stock has shown a significant downward trend, potentially opening up opportunities for strategic buying as it approaches key technical levels.
Fibonacci Analysis
| Details | Information |
|---|---|
| Trend Duration | 2025-12-30 to 2026-04-06 |
| High Price & Date | 1745.75 on 2025-12-30 |
| Low Price & Date | 1011.06 on 2026-03-27 |
| Fibonacci Levels |
|
| Current Price | 1092.84 |
| Retracement Zone | None |
| Interpretation | The current price is outside major retracement levels, suggesting potential for further downside before reaching key support zones. |
Conclusion
The Fair Isaac Corporation has encountered a notable downward trajectory, with its stock price declining significantly from its previous highs. This movement could indicate underlying challenges in the company's market environment or opportunities for strategic acquisitions in response to structural changes in its segments. Despite a strong command in analytics and decision management, investors should be cautious given the absence of a clear retracement support. Analysts should monitor for potential rebounds at lower technical levels while considering external economic factors affecting the technology space.