August 02, 2025 a 10:16 am
FICO: Fibonacci Analysis - Fair Isaac Corporation
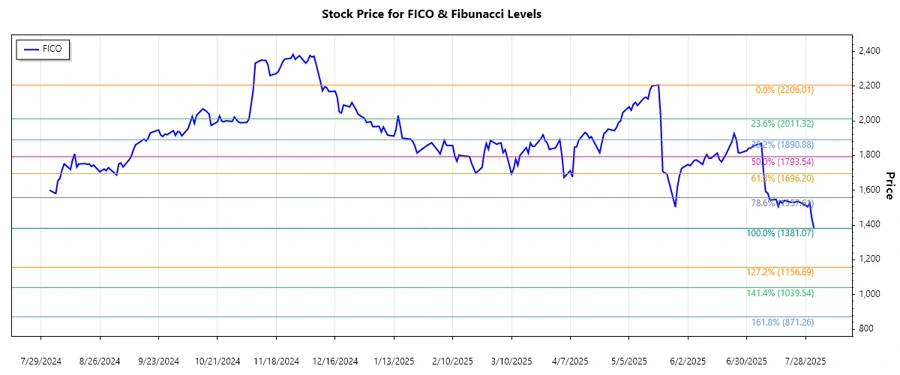
Fair Isaac Corporation (FICO) has proven to be a dominant player in the analytics and decision management software market. Over the last few months, its stock price has experienced significant fluctuations, reflecting broader market trends and company-specific developments. Notably, the company has recently seen a downward trend, driven by global market conditions and competitive pressures. Analysts and investors are keen to understand whether FICO can leverage its strong market position to regain upward momentum. The upcoming analysis will uncover key support and resistance levels through a detailed Fibonacci retracement study.
Fibonacci Analysis
| Analysis Detail | Information |
|---|---|
| Trend Type | Downtrend |
| Start Date | 2025-05-19 |
| End Date | 2025-08-01 |
| High Point | 2206.01 on 2025-05-19 |
| Low Point | 1381.07 on 2025-08-01 |
| Current Price | 1381.07 |
Fibonacci Retracement Levels
| Level | Price |
|---|---|
| 0.236 | 1722.27 |
| 0.382 | 1820.80 |
| 0.5 | 1793.54 |
| 0.618 | 1919.28 |
| 0.786 | 2061.46 |
The current price of FICO is far below the nearest Fibonacci retracement level of 0.236, indicating that it is not within any retracement zone. Technically, this suggests a strong downward momentum, with no immediate support between current levels and the recent low.
Conclusion
Fair Isaac Corporation is currently experiencing a significant bearish trend. The Fibonacci analysis indicates a potential for further declines as the price has not retraced into key resistance zones. For investors, this highlights increased risk, although opportunities may arise if the stock approaches a support level. If it breaks beyond recent lows, the downtrend could accelerate. Monitoring bullish catalysts and market sentiment will be crucial for future analysis. Potential recovery hinges on strong fundamentals and external market developments.
Smart Data Insight
Master the Perfect Entry & Exit for this Stock
Don't leave your profits to chance. Historically, this stock follows specific seasonal patterns that institutional traders use to maximize returns.
- ✅ Identify the "Golden Buying Window"
- ✅ Avoid high-risk correction cycles
- ✅ Backtested data from the last 20+ years