September 18, 2025 a 03:15 am
FFIV: Trend and Support & Resistance Analysis - F5, Inc.
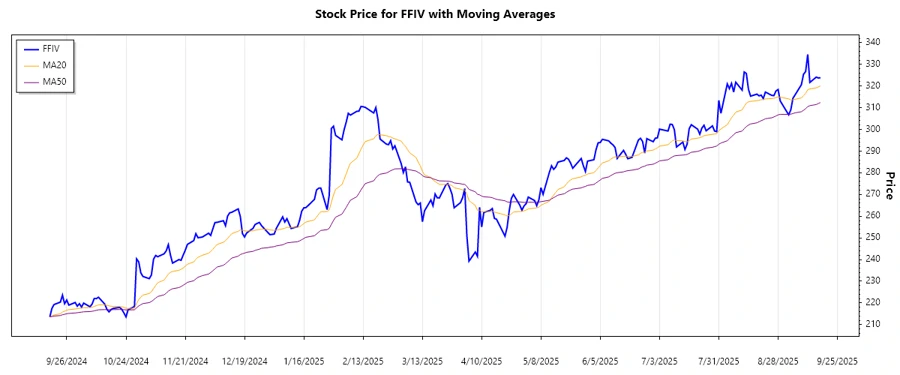
F5, Inc. operates in the dynamic industry of multi-cloud application security and delivery solutions, with a strong presence in both hardware and software solutions. This analysis focuses on the stock's recent trends and key levels of support and resistance, which are crucial for investors. The examination of the exponential moving averages provides insight into the current market sentiment for F5, Inc.
Trend Analysis
| Date | Closing Price | Trend |
|---|---|---|
| 2025-09-17 | $323.81 | ▲ Uptrend |
| 2025-09-16 | $323.73 | ▲ Uptrend |
| 2025-09-15 | $324.10 | ▲ Uptrend |
| 2025-09-12 | $321.67 | ▲ Uptrend |
| 2025-09-11 | $334.59 | ▲ Uptrend |
| 2025-09-10 | $326.69 | ▲ Uptrend |
| 2025-09-09 | $325.41 | ▲ Uptrend |
The analysis of the 20-day and 50-day exponential moving averages (EMA) shows a predominant uptrend, as the EMA20 is consistently above the EMA50. This suggests continuous investor confidence and a likely continuation of the bullish trend.
Support and Resistance
| Zone | From | To |
|---|---|---|
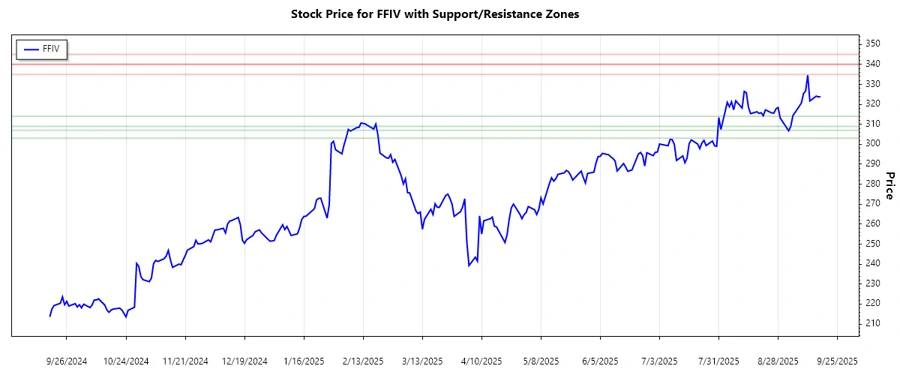
| Support 1 | → | $314.00 |
| Support 2 | → | $307.00 |
| Resistance 1 | → | $335.00 |
| Resistance 2 | → | $340.00 |
Currently, the price is just below the first resistance level at $335.00, which indicates it may approach this barrier. A breakthrough could signal further upside potential.
Conclusion
F5, Inc. shows robust performance potential in the application services sector, as evidenced by the upward trend in its stock price. The consistent uptrend and proximity to resistance may present an opportunity for bullish investors. However, the stock is nearing a potential resistance, which could lead to a short-term pullback if not breached. Strategically placing stop-loss orders around the identified support zones can offer investors protection against downside risks. Overall, the company's strategic alliances and robust product portfolio support a positive long-term outlook for its stock.
Smart Data Insight
Master the Perfect Entry & Exit for this Stock
Don't leave your profits to chance. Historically, this stock follows specific seasonal patterns that institutional traders use to maximize returns.
- ✅ Identify the "Golden Buying Window"
- ✅ Avoid high-risk correction cycles
- ✅ Backtested data from the last 20+ years