
July 11, 2026 a 01:00 pm

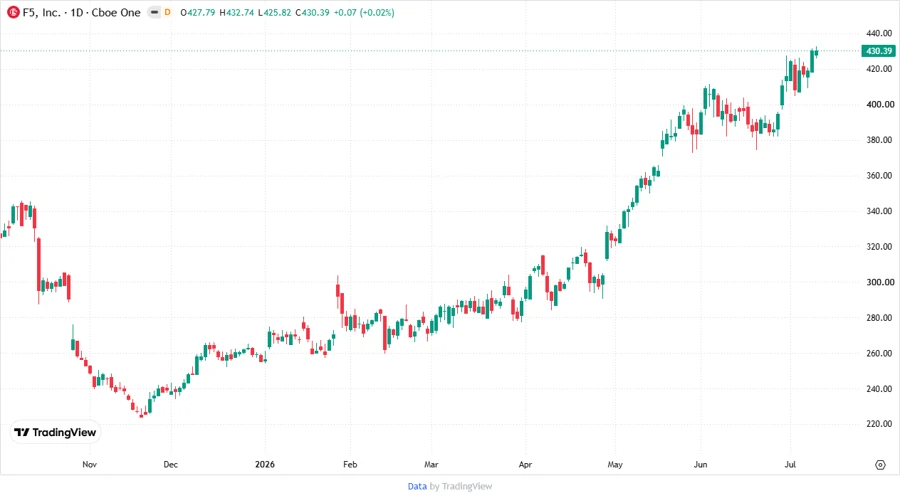
FFIV: Fundamental Ratio Analysis - F5, Inc.
The F5, Inc. stock, represented by the ticker FFIV, currently presents a stable outlook. With a focus on secure and optimized application delivery, its business model is well aligned with the ongoing technology shift towards cloud solutions. The stock's ratings indicate potential for growth, albeit with some market volatility considerations.
Fundamental Rating
The fundamental rating for F5, Inc. suggests a solid position with room for improvement in certain financial metrics.
| Category | Score | Visual |
|---|---|---|
| Discounted Cash Flow | 4 | |
| Return on Equity | 4 | |
| Return on Assets | 4 | |
| Debt to Equity | 3 | |
| Price to Earnings | 2 | |
| Price to Book | 2 |
Historical Rating
Examining the historical rating allows for a clearer view of F5, Inc.'s consistent performance in crucial areas.
| Date | Overall Score | DCF | ROE | ROA | D/E | P/E | P/B |
|---|---|---|---|---|---|---|---|
| 2026-07-10 | 3 | 4 | 4 | 4 | 3 | 2 | 2 |
| Previous | 0 | 4 | 4 | 4 | 3 | 2 | 2 |
Analyst Price Targets
Analysts provide a broad price target spectrum, indicating varying projections of F5, Inc.'s future value.
| High | Low | Median | Consensus |
|---|---|---|---|
| $475 | $292 | $450 | $405.67 |
Analyst Sentiments
The analyst sentiment for F5, Inc. shows a predominant inclination to hold, with a notable portion advising to buy.
| Recommendation | Count | Visual |
|---|---|---|
| Strong Buy | 1 | |
| Buy | 24 | |
| Hold | 33 | |
| Sell | 3 | |
| Strong Sell | 0 |
Conclusion
F5, Inc. stands as a formidable player in the tech landscape, with strong fundamentals reinforced by adept navigation of the multi-cloud environment. Its strategic alliances with major cloud providers bolster its market posture, though it contends with sector volatility. While analysts largely recommend holding, the substantial forward-looking innovations F5 deploys may warrant optimism. Prospective investors should remain mindful of fluctuating industry metrics and global economic conditions. Overall, FFIV embodies a balanced investment prospect with measured growth potential.
Smart Data Insight
Master the Perfect Entry & Exit for this Stock
Don't leave your profits to chance. Historically, this stock follows specific seasonal patterns that institutional traders use to maximize returns.
- ✅ Identify the "Golden Buying Window"
- ✅ Avoid high-risk correction cycles
- ✅ Backtested data from the last 20+ years