
July 05, 2026 a 03:15 am

FE: Trend and Support & Resistance Analysis - FirstEnergy Corp.
FirstEnergy Corp., involved in providing comprehensive electricity services, shows significant price movements tested against strategic support and resistance zones. While technical analysis reveals a cautious trend, prospective investors must assess the fundamental factors influencing electricity demand and regulatory policies.
Trend Analysis
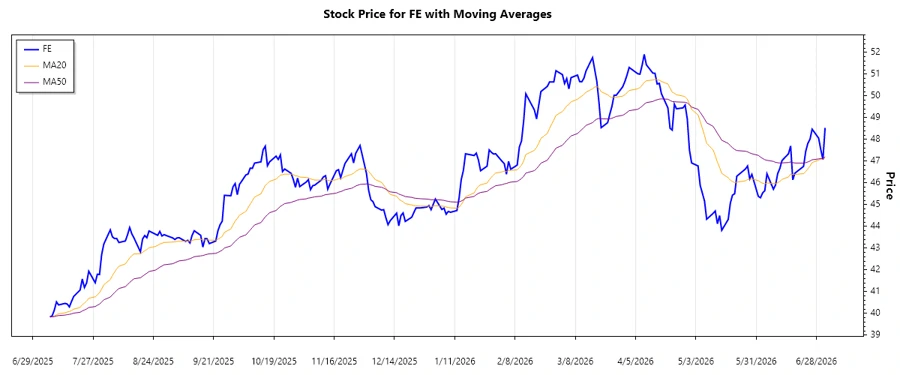
The trend analysis based on the closing prices of FirstEnergy Corp. indicates that the stock has fluctuated, showing a recent upward movement. Notably, when EMA20 exceeds EMA50, an uptrend symbol is projected, and conversely, when EMA20 is less than EMA50, a downtrend symbol is anticipated. Here are the data for the last 7 days:
| Date | Closing Price | Trend |
|---|---|---|
| 2026-06-24 | 47.82 | ▼ |
| 2026-06-25 | 48.01 | ▲ |
| 2026-06-26 | 48.47 | ▲ |
| 2026-06-29 | 48.06 | ▼ |
| 2026-06-30 | 47.54 | ▼ |
| 2026-07-01 | 47.07 | ▼ |
| 2026-07-02 | 48.53 | ▲ |
The recent closing prices manifest a predominantly sideways movement, suggesting investors should remain vigilant of potential breakout opportunities.
Support and Resistance
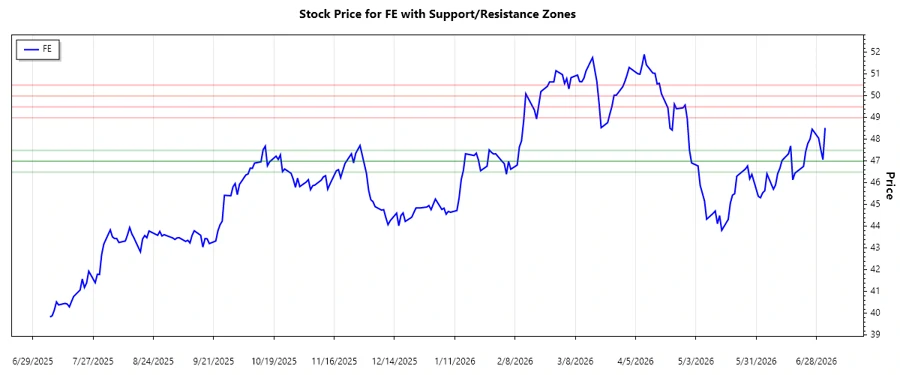
Support and resistance levels provide crucial insights into possible price reversals. Calculated support levels where downward price movements may halt include:
| Zone | From | To | |
|---|---|---|---|
| Support 1 | 47.00 | 47.50 | ▼ |
| Support 2 | 46.50 | 47.00 | ▼ |
Possible resistance levels, areas where a price climb may reverse, are identified as follows:
| Zone | From | To | |
|---|---|---|---|
| Resistance 1 | 49.00 | 49.50 | ▲ |
| Resistance 2 | 50.00 | 50.50 | ▲ |
As of now, the price closely interacts within or near the support zone 1, indicating a critical area for further price action vigilance.
Conclusion
From a technical standpoint, FirstEnergy Corp.'s price depicts a largely sideways movement with recent support and resistance areas identified, enabling traders to prepare for potential trend reversals. The pending movement within the identified zones will be crucial in shaping short-term trading strategies. While the inherent risks of fluctuating energy policies pose challenges, a robust operational framework may provide resilience, contributing positively to its market performance.
Smart Data Insight
Master the Perfect Entry & Exit for this Stock
Don't leave your profits to chance. Historically, this stock follows specific seasonal patterns that institutional traders use to maximize returns.
- ✅ Identify the "Golden Buying Window"
- ✅ Avoid high-risk correction cycles
- ✅ Backtested data from the last 20+ years