September 27, 2025 a 08:15 am
FE: Trend and Support & Resistance Analysis - FirstEnergy Corp.
FirstEnergy Corp., a major player in the electricity generation, transmission, and distribution industry in the United States, has shown some interesting movements in its stock prices over the recent months. Despite fluctuations, the stock appears to have some solid foundational supports that investors are keeping a close watch on. As with any utility company, the blend of different energy sources and a solid customer base provides a certain degree of stability amid market volatility.
Trend Analysis
| Date | Closing Price | Trend |
|---|---|---|
| 2025-09-26 | $45.43 | ▲ |
| 2025-09-25 | $44.24 | ▼ |
| 2025-09-24 | $44.08 | ⚖️ |
| 2025-09-23 | $43.80 | ▼ |
| 2025-09-22 | $43.33 | ▼ |
| 2025-09-19 | $43.21 | ⚖️ |
| 2025-09-18 | $43.43 | ▲ |
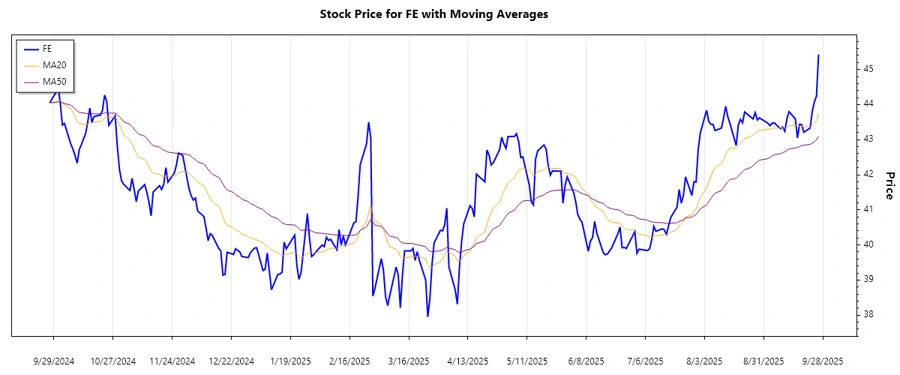
The recent trend analysis indicates that FirstEnergy Corp.'s stock is showing mixed signals with slight inclinations toward a selling pressure. The EMA20 and EMA50 crossover calculations highlight a potential ▲ uptrend emerging, suggesting caution for short-term downward pressures, albeit weak.
Support- and Resistance
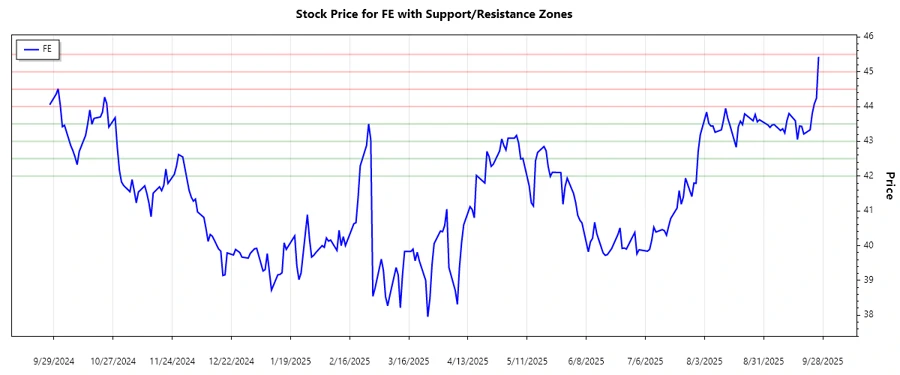
| Zone Type | From ($) | To ($) |
|---|---|---|
| Support 1 | 42.00 | 42.50 |
| Support 2 | 43.00 | 43.50 |
| Resistance 1 | 44.00 | 44.50 |
| Resistance 2 | 45.00 | 45.50 |
The current price is oscillating around the Resistance 1 zone suggesting a potential consolidation phase or breakout scenario. This provides a critical level for traders to watch closely.
Conclusion
FirstEnergy Corp.’s stock price dynamics unveil a critical interaction between its support and resistance levels. These levels provide potential pivot zones for the stock amid broader market and sector-specific conditions. Investors may look at the current price with a strategic view, gauging movements within these zones for potential trading opportunities. The mixed trend signals warrant caution alongside the emerging stabilizing signals evident in the company's broad market influence.
Smart Data Insight
Master the Perfect Entry & Exit for this Stock
Don't leave your profits to chance. Historically, this stock follows specific seasonal patterns that institutional traders use to maximize returns.
- ✅ Identify the "Golden Buying Window"
- ✅ Avoid high-risk correction cycles
- ✅ Backtested data from the last 20+ years