September 03, 2025 a 03:15 am
FE: Trend and Support & Resistance Analysis - FirstEnergy Corp.
The stock price of FirstEnergy Corp. has shown a noticeable trend over the recent months. The company's reliance on diverse energy sources and its extensive customer base provides stability. However, fluctuations in energy prices and regulatory changes can impact its financial performance. Investors should monitor these factors closely along with technical indicators to gauge future price movements.
Trend Analysis
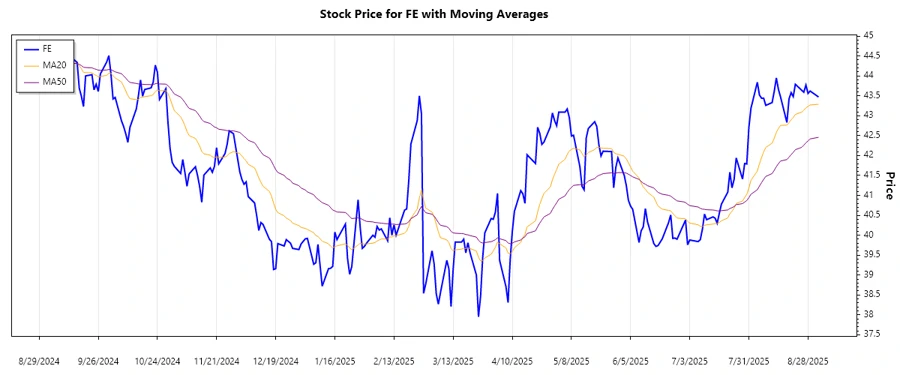
Recent analysis of FirstEnergy Corp. shows that the stock price demonstrates a predominantly stable trend with slight fluctuations. Calculating the EMA20 and EMA50 allows for a better understanding of this movement and the direction it may be heading.
| Date | Close Price | Trend |
|---|---|---|
| 2025-09-02 | 43.47 | ⚖️ |
| 2025-08-29 | 43.62 | ▲ |
| 2025-08-28 | 43.56 | ⚖️ |
| 2025-08-27 | 43.77 | ▲ |
| 2025-08-26 | 43.59 | ▼ |
| 2025-08-25 | 43.64 | ⚖️ |
| 2025-08-22 | 43.79 | ▲ |
The observed EMA values suggest a mostly stable trend, with slight upward movement reflected by alternating indications of rise and steadiness over the past week.
Support and Resistance Analysis
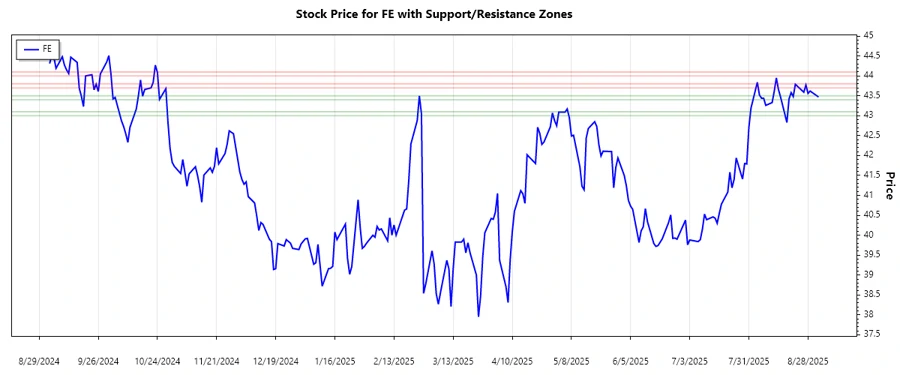
The support and resistance analysis for FirstEnergy Corp. reveals the presence of significant price levels that act as barriers to further price movements.
| Zone Type | From | To | Indicator |
|---|---|---|---|
| Support Zone 1 | 43.40 | 43.50 | ⬇️ |
| Support Zone 2 | 43.00 | 43.10 | ⬇️ |
| Resistance Zone 1 | 43.70 | 43.80 | ⬆️ |
| Resistance Zone 2 | 44.00 | 44.10 | ⬆️ |
The current price is oscillating within the range of a critical resistance zone, suggesting potential resistance to further price increases at this level.
Conclusion
FirstEnergy Corp.'s stock maintains a largely stable technical stance, reflecting a slight upward trajectory within a defined range of support and resistance levels. Potential investors should be mindful of the broader energy market conditions and regulatory dynamics that may influence volatility. From a technical perspective, the stock currently encounters resistance, suggesting cautious optimism. Continued observation of EMA values and respecting major price zones are recommended for informed decision-making. Analysts should consider these technical insights to garner a rounded view of market behaviour.
Smart Data Insight
Master the Perfect Entry & Exit for this Stock
Don't leave your profits to chance. Historically, this stock follows specific seasonal patterns that institutional traders use to maximize returns.
- ✅ Identify the "Golden Buying Window"
- ✅ Avoid high-risk correction cycles
- ✅ Backtested data from the last 20+ years