
May 25, 2026 a 11:44 am
FE: Fibonacci Analysis - FirstEnergy Corp.
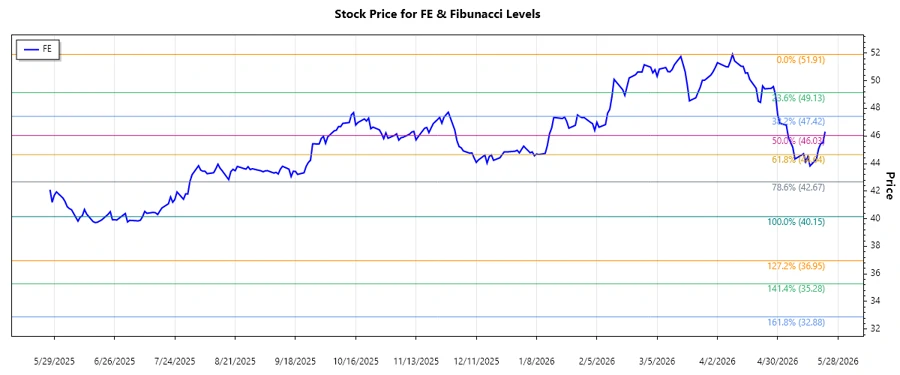
FirstEnergy Corp., operating in the regulated electricity sector, has observed recent volatility. The stock's pricing movement reflects its response to market dynamics, regulatory changes, and energy sector trends. An in-depth Fibonacci analysis provides insights into potential support and resistance levels. Understanding these technical indicators can enhance investment strategies in the current market environment.
Fibonacci Analysis
| Details | Values |
|---|---|
| Start Date | 2025-09-19 |
| End Date | 2026-05-22 |
| High Point | $51.91 on 2026-04-09 |
| Low Point | $40.15 on 2025-07-09 |
| Current Price | $46.31 |
| Fibonacci Level | Price Level |
|---|---|
| 0.236 | $48.75 |
| 0.382 | $47.32 |
| 0.5 | $46.03 |
| 0.618 | $44.74 |
| 0.786 | $43.06 |
The current price is situated around the 0.5 Fibonacci retracement level of $46.03, indicating that the stock is within a critical technical juncture. Investors may interpret this level as a potential area of support, suggesting a possible buying opportunity if the price consolidates or bounces upward from this point.
Conclusion
FirstEnergy Corp.'s recent price action reflects a corrective phase, with potential stabilization near significant Fibonacci levels. Investors should watch for bullish signals near the 0.5 retracement level, as a confirmation could suggest continued upward momentum or reversal patterns. Risk remains, however, should prices fail to hold key support levels, leading to potential downside continuation. Overall, the technical setup showcases both opportunities and challenges reflective of broader market conditions and sector-specific developments.
Smart Data Insight
Master the Perfect Entry & Exit for this Stock
Don't leave your profits to chance. Historically, this stock follows specific seasonal patterns that institutional traders use to maximize returns.
- ✅ Identify the "Golden Buying Window"
- ✅ Avoid high-risk correction cycles
- ✅ Backtested data from the last 20+ years