December 11, 2025 a 04:44 pm

FE: Fibonacci Analysis - FirstEnergy Corp.
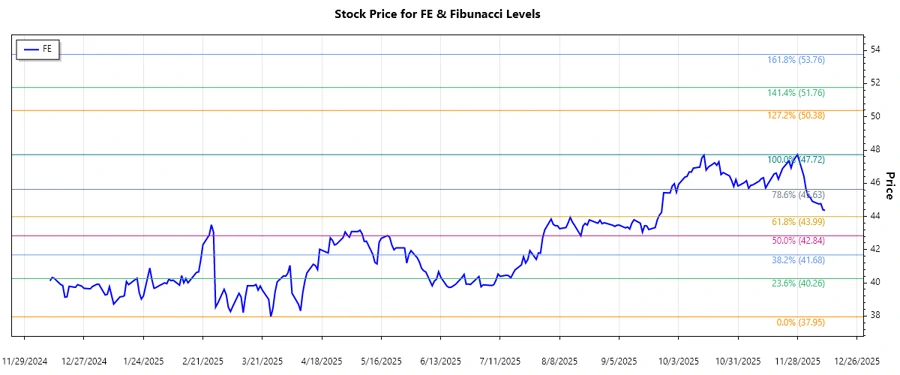
The recent analysis of FirstEnergy Corp.'s stock shows a prominent upward trend in recent months. The company, known for its diversified energy transmission and distribution business, serves a substantial customer base across several states. With a mix of generation facilities, the stock's performance is influenced by both regulatory factors and energy market conditions. Given the identified trend, a Fibonacci Retracement Analysis was conducted to forecast potential support and resistance levels.
Fibonacci Analysis
The analysis reveals that FirstEnergy Corp. is experiencing an upward trend, beginning late March 2025 and continuing through early December 2025. The Fibonacci Retracement Levels are calculated as follows:
| Aspect | Details |
|---|---|
| Start Date | 2025-03-24 |
| End Date | 2025-12-11 |
| High Point | 47.72 (2025-11-28) |
| Low Point | 37.95 (2025-03-25) |
| Fibonacci Level | Price |
|---|---|
| 0.236 | 40.34 |
| 0.382 | 42.20 |
| 0.5 | 43.83 |
| 0.618 | 45.45 |
| 0.786 | 47.15 |
Currently, the price is around 44.365, which places it between the 0.5 and 0.618 retracement levels. This suggests that the stock is potentially within a retracement area, possibly gearing towards a new resistance span.
Technically, if the price holds above the 0.5 level, it could indicate a continuation of the upward trajectory, using this retracement as a support level.
Conclusion
This upward trend in FirstEnergy Corp.'s stock presents both opportunities and risks. A breaking above the 0.618 level might signal further upward potential. Conversely, failing to maintain levels above 0.5 could expose the stock to a downside risk. Analysts should closely monitor these Fibonacci levels as they can provide critical insight into potential support and resistance zones. Factors such as regulatory changes and energy market conditions remain pivotal in influencing future trends.