
July 19, 2026 a 03:31 am
FE: Dividend Analysis - FirstEnergy Corp.
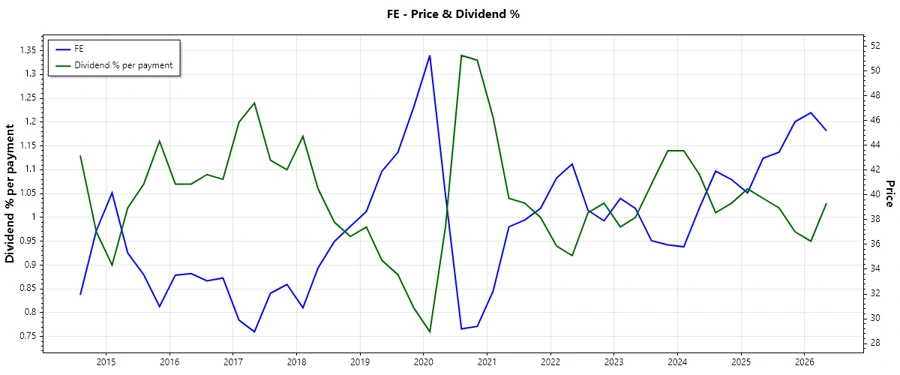
FirstEnergy Corp. presents a notable dividend profile with consistent yield and stable growth metrics. Though the high payout ratio suggests caution, the overall dividend history and sector performance make it a potential candidate for income-focused portfolios. Recent dividend growth and stability over nearly three decades speak to its resilience as a dividend payer.
📊 Overview
FirstEnergy, operating in the Utilities sector, provides a promising dividend yield of approximately 3.98%. With a current yearly dividend per share of $1.76 and an impressive 29-year history of dividend payments, it indicates strength in its dividend policy. The lack of recent dividend cuts further reinforces investor confidence.
| Metric | Details |
|---|---|
| Sector | Utilities |
| Dividend Yield | 3.98% |
| Current Dividend per Share | $1.76 |
| Dividend History | 29 Years |
| Last Cut/Suspension | None |
🗣️ Dividend History
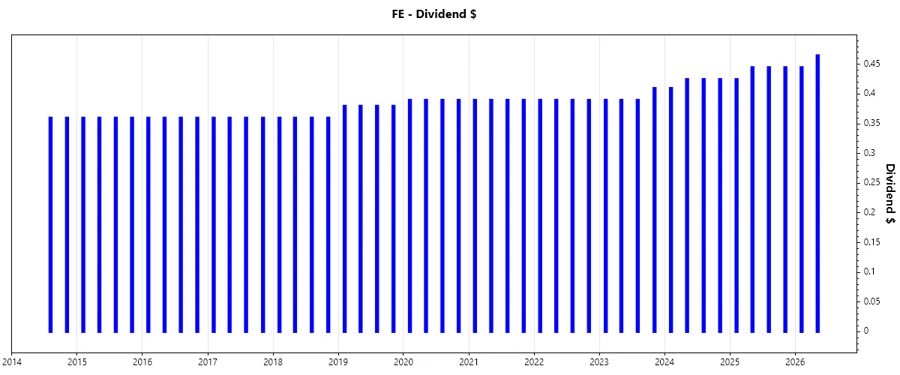
FirstEnergy has a long-standing tradition of consistent dividend payments, critical for evaluating its reliability in dividend distribution. This history supports the company’s commitment to returning capital to shareholders.
| Year | Dividend per Share (USD) |
|---|---|
| 2026 | 0.91 |
| 2025 | 1.76 |
| 2024 | 1.685 |
| 2023 | 1.58 |
| 2022 | 1.56 |
📈 Dividend Growth
Dividend growth is essential for assessing future dividend potential and long-term profitability. FirstEnergy’s moderate growth over the past few years showcases a stable yet gradual increase.
| Time | Growth |
|---|---|
| 3 years | 4.10% |
| 5 years | 2.44% |
The average dividend growth is 2.44% over 5 years. This shows moderate but steady dividend growth.
📉 Payout Ratio
The payout ratio analysis reflects FirstEnergy’s ability to sustain its dividends from current earnings and cash flows. A high EPS-based payout ratio of 95.56% indicates a high percentage of earnings dedicated to dividend payments, necessitating careful monitoring.
| Key Figure | Ratio |
|---|---|
| EPS-based | 95.56% |
| Free Cash Flow-based | 56.74% |
A 95.56% EPS payout denotes high dividend distribution against earnings, which could limit growth potential but ensures strong capital return to shareholders. A FCF payout of 56.74% provides a more conservative buffer.
✅ Cashflow & Capital Efficiency
Evaluating cash flow metrics is essential for understanding FirstEnergy's operational efficiency and dividend coverage.
| Metric | 2023 | 2024 | 2025 |
|---|---|---|---|
| Free Cash Flow Yield | -9.37% | -4.98% | -3.89% |
| Earnings Yield | 5.25% | 4.28% | 3.95% |
| CAPEX to Operating Cash Flow | 241.96% | 139.40% | 44.09% |
| Stock-based Compensation to Revenue | 0% | 0% | 0% |
| Free Cash Flow / Operating Cash Flow Ratio | -141.96% | -39.40% | -27.16% |
The data indicates FirstEnergy’s challenges with negative FCF yield recently, but its earnings yield presentations offer insight into potential profit-making capacitances. A high-capex ratio signals considerable expansion investments.
⚠️ Balance Sheet & Leverage Analysis
FirstEnergy's balance sheet and leverage metrics indicate the firm's long-run financial stability and potential risks.
| Metric | 2023 | 2024 | 2025 |
|---|---|---|---|
| Debt-to-Equity | 2.39 | 1.95 | 2.16 |
| Debt-to-Assets | 51.08% | 46.63% | 48.42% |
| Debt-to-Capital | 70.47% | 66.08% | 68.39% |
| Net Debt to EBITDA | 6.27 | 5.89 | 6.34 |
| Current Ratio | 0.48 | 0.56 | 0.57 |
| Quick Ratio | 0.38 | 0.45 | 0.46 |
| Financial Leverage | 4.67 | 4.18 | 4.47 |
The relatively high leverage and debt ratios highlight elevated risks, though manageable in stable interest rate environments. The quick ratio needs improvement for robust short-term liquidity.
📈 Fundamental Strength & Profitability
Fundamental indicators such as ROE, ROA, and margins are pivotal in evaluating profitability and operational strength.
| Metric | 2023 | 2024 | 2025 |
|---|---|---|---|
| Return on Equity (ROE) | 10.56% | 7.85% | 8.15% |
| Return on Assets (ROA) | 2.26% | 1.88% | 1.82% |
| Margins: Net | 8.56% | 7.26% | 6.76% |
| Margins: EBIT | 19.36% | 18.67% | 17.89% |
| Margins: EBITDA | 30.71% | 30.46% | 28.19% |
| Margins: Gross | 63.90% | 67.52% | 54.77% |
| R&D to Revenue | 0% | 0% | 0% |
Despite stable profitability, a lack of investment in R&D could limit future growth potential. Strong net margins indicate efficient cost management but watch for ROA trends since they offer insight into asset utilization efficiency.
📊 Price Development
✅ Dividend Scoring System
| Criterion | Score | Score Bar |
|---|---|---|
| Dividend Yield | 4 | |
| Dividend Stability | 5 | |
| Dividend Growth | 3 | |
| Payout Ratio | 3 | |
| Financial Stability | 4 | |
| Dividend Continuity | 5 | |
| Cashflow Coverage | 3 | |
| Balance Sheet Quality | 3 |
Overall Score: 30/40
🗣️ Rating
FirstEnergy Corp. offers a balanced dividend profile suitable for conservative investors valuing stability over aggressive growth. With essential dividend metrics rated favorably, its position in a traditionally stable sector enhances its attractiveness as a reliable dividend player. However, potential investors should consider monitoring financial stability aspects and future growth strategies to ensure sustained returns.
Smart Data Insight
Master the Perfect Entry & Exit for this Stock
Don't leave your profits to chance. Historically, this stock follows specific seasonal patterns that institutional traders use to maximize returns.
- ✅ Identify the "Golden Buying Window"
- ✅ Avoid high-risk correction cycles
- ✅ Backtested data from the last 20+ years