May 08, 2026 a 07:31 am
📊 Dividend Analysis - FirstEnergy Corp.
FirstEnergy Corp. offers a promising dividend profile, supported by its longstanding dividend history of 29 years. With a dividend yield of 3.98%, the company stands as a stable choice for income-oriented investors. Despite high EPS payout ratios, its cash flow-based metrics indicate a managed dividend strategy, maintaining a balance between rewarding shareholders and sustaining operational needs.
Overview
FirstEnergy Corp. is positioned in the Utilities sector, offering a robust dividend yield of 3.98% and a solid history of dividend payments spanning 29 years. The company has consistently provided returns to its shareholders with a current dividend per share of $1.76. The lack of recent dividend cuts or suspensions further validates its commitment to sustaining shareholder value.
| Metric | Details |
|---|---|
| Sector | Utilities |
| Dividend Yield | 3.98% |
| Current Dividend per Share | $1.76 |
| Dividend History | 29 years |
| Last Cut or Suspension | None |
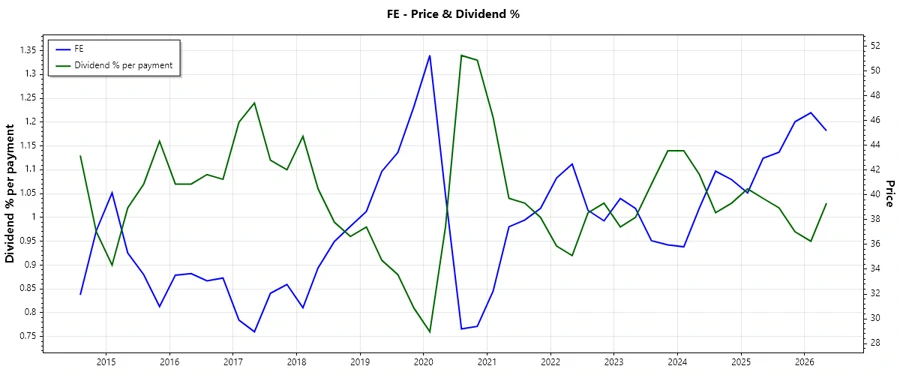
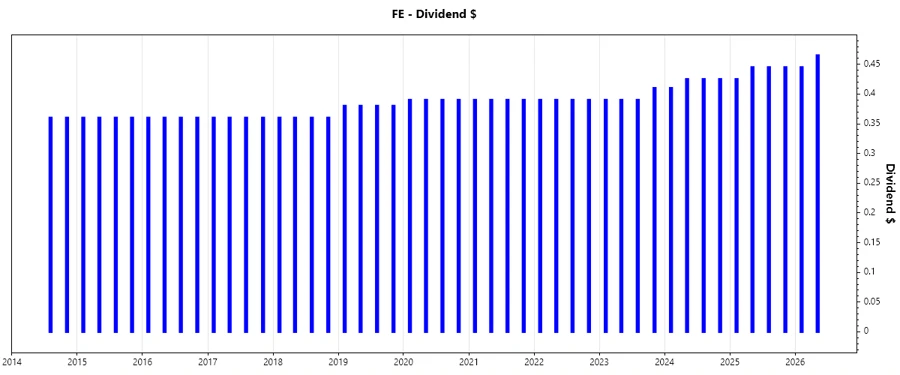
Dividend History
The long-term dividend history of FirstEnergy Corp. reinforces investor confidence, illustrating a trend of sustained returns. The historical stability underscores the company’s operational strength and ability to consistently generate cash flows.
| Year | Dividend per Share (USD) |
|---|---|
| 2026 | 0.910 |
| 2025 | 1.760 |
| 2024 | 1.685 |
| 2023 | 1.58 |
| 2022 | 1.56 |
Dividend Growth
The observed dividend growth over a three and five-year period depicts a modest but positive trajectory, highlighting operational resilience and a commitment to enhancing shareholder wealth. This growth momentum is essential for future income stream predictions.
| Time | Growth |
|---|---|
| 3 years | 4.1% |
| 5 years | 2.4% |
The average dividend growth is 2.4% over 5 years. This shows moderate but steady dividend growth.
Payout Ratio
Analyzing payout ratios is critical for understanding dividend sustainability. FirstEnergy exhibits a high EPS-based payout ratio of 95.56%, which suggests most of the earnings are distributed as dividends. However, the free cash flow-based payout ratio of 56.74% indicates the company’s capacity to cover its dividends from cash generated, providing a safety cushion.
| Key Figure | Ratio |
|---|---|
| EPS-based | 95.56% |
| Free Cash Flow-based | 56.74% |
The high EPS payout ratio hints at potential vulnerability if earnings decline, while the FCF ratio shows a more conservative and sustainable level of dividend coverage.
Cashflow & Capital Efficiency
The cash flow analysis reveals critical insights into operational fortitude and capital allocation. A negative free cash flow ratio suggests potential reinvestment requirements, yet positive earnings yield reflects efficiency.
| Metric | 2023 | 2024 | 2025 |
|---|---|---|---|
| Free Cash Flow Yield | -9.37% | -4.98% | -3.89% |
| Earnings Yield | 5.25% | 4.28% | 3.95% |
| CAPEX to Operating Cash Flow | 241.96% | 139.40% | 127.16% |
| Stock-based Compensation to Revenue | 0% | 0% | 0% |
| Free Cash Flow / Operating Cash Flow Ratio | -141.96% | -39.40% | -27.16% |
| Return on Invested Capital | 4.08% | 3.66% | 4.46% |
The cash flow metrics point towards aggressive capital reinvestment and efficiency in utilizing operating income.
Balance Sheet & Leverage Analysis
Leverage metrics are crucial for assessing potential risks related to debt obligations. FirstEnergy maintains a high debt-to-equity ratio, though stable coverage ratios indicate management’s strategic debt handling ability.
| Metric | 2023 | 2024 | 2025 |
|---|---|---|---|
| Debt-to-Equity | 2.39 | 1.95 | 2.16 |
| Debt-to-Assets | 51.08% | 46.63% | 48.42% |
| Debt-to-Capital | 70.47% | 66.08% | 68.39% |
| Net Debt to EBITDA | 6.27 | 5.89 | 6.15 |
| Current Ratio | 0.48 | 0.56 | 0.52 |
| Quick Ratio | 0.38 | 0.45 | 0.46 |
| Financial Leverage | 4.67 | 4.18 | 4.47 |
While high leverage could increase financial strain during downturns, coverage and solvency metrics suggest manageable risks.
Fundamental Strength & Profitability
Profitability ratios illustrate FirstEnergy's operational effectiveness, pinpointing strength in asset utilization and equity returns. Net margins display consistent earnings quality relative to revenue.
| Metric | 2023 | 2024 | 2025 |
|---|---|---|---|
| Return on Equity | 10.56% | 7.85% | 8.15% |
| Return on Assets | 2.26% | 1.88% | 1.82% |
| Net Margin | 8.56% | 7.26% | 6.76% |
| EBIT Margin | 19.36% | 18.67% | 18.77% |
| EBITDA Margin | 30.71% | 30.46% | 29.08% |
| Gross Margin | 63.90% | 67.52% | 54.77% |
| Research & Development to Revenue | 0% | 0% | 0% |
High net and EBIT margins reflect FirstEnergy's capacity to maintain profit levels amidst rising costs, showcasing operational robustness.
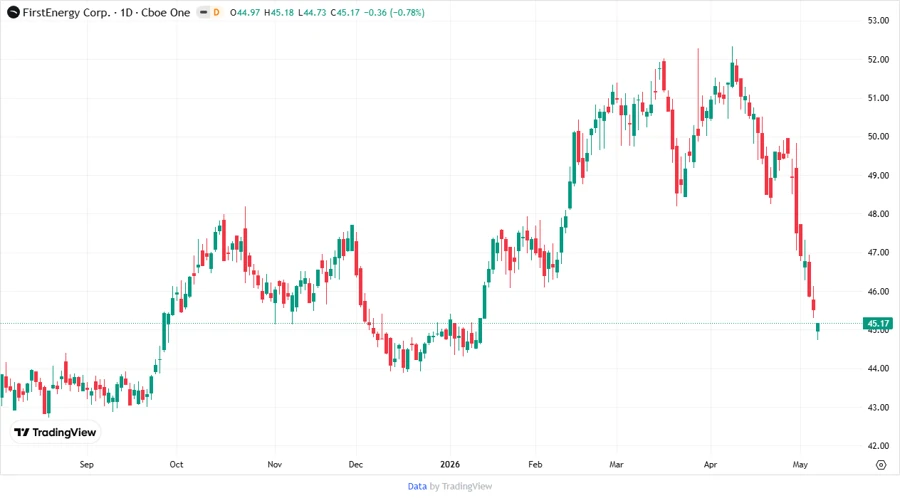
Price Development
Dividend Scoring System
Each category is assessed to provide insights into FirstEnergy’s dividend potential and stability:
| Criterion | Score | |
|---|---|---|
| Dividend yield | 4 | |
| Dividend Stability | 4 | |
| Dividend growth | 3 | |
| Payout ratio | 3 | |
| Financial stability | 3 | |
| Dividend continuity | 5 | |
| Cashflow Coverage | 3 | |
| Balance Sheet Quality | 3 |
Overall Score: 28 out of 40
Rating
✅ Final Recommendation: FirstEnergy Corp. presents a compelling option for dividend-seeking investors due to its historical stability and yield metrics. Given its high EPS payout, cautious monitoring of profit growth is advisable alongside a focus on free cash flow coverage. The overall outlook suggests moderate risk with attractive long-term income potential.
Smart Data Insight
Master the Perfect Entry & Exit for this Stock
Don't leave your profits to chance. Historically, this stock follows specific seasonal patterns that institutional traders use to maximize returns.
- ✅ Identify the "Golden Buying Window"
- ✅ Avoid high-risk correction cycles
- ✅ Backtested data from the last 20+ years