February 22, 2026 a 03:31 am


FE: Dividend Analysis - FirstEnergy Corp.
FirstEnergy Corp. exhibits a steadfast commitment to shareholder returns with a focus on sustainability in its dividend distributions. The company's ability to maintain a commendable dividend yield, alongside steady growth over the years, speaks volumes of its disciplined financial management. However, leveraging and payout ratios indicate areas that require attention to ensure long-term dividend sustainability.
📊 Overview
FirstEnergy Corp. operates in the Utilities sector, which is known for its relatively stable cash flows and consistent dividend payments. The company's dividend yield stands at 3.59%, with a current dividend per share of $1.76. Notably, FirstEnergy has a dividend history spanning 29 years, demonstrating its long-term commitment to rewarding shareholders, though it has undergone dividend adjustments in the past.
| Aspect | Details |
|---|---|
| Sector | Utilities |
| Dividend yield | 3.59% |
| Current dividend per share | 1.76 USD |
| Dividend history | 29 years |
| Last cut or suspension | None |
📈 Dividend History
The historical trend of dividend payments is a vital indicator of a company's fiscal health and management's commitment to its dividend policy. With 29 years of payments, FirstEnergy shows commitment, although strategic adjustments in payments are evident.
| Year | Dividend per Share (USD) |
|---|---|
| 2026 | 0.91 |
| 2025 | 1.76 |
| 2024 | 1.68 |
| 2023 | 1.58 |
| 2022 | 1.56 |
📊 Dividend Growth
Analyzing dividend growth helps in understanding the company’s ability to increase its dividend payouts. FirstEnergy's average dividend growth over 5 years is a modest 2.44%, indicating a measured approach to increasing shareholder returns while maintaining financial stability.
| Time | Growth |
|---|---|
| 3 years | 4.10% |
| 5 years | 2.44% |
The average dividend growth is 2.44% over 5 years. This shows moderate but steady dividend growth.
📉 Payout Ratio
The payout ratio is crucial in assessing how sustainable a company’s dividend is. An EPS-based payout of 79.94% and a free cash flow-based payout of 40.14% at FirstEnergy indicates a high reliance on earnings, with room for improvement regarding cash flow sustainability.
| Key figure | Ratio |
|---|---|
| EPS-based | 79.94% |
| Free cash flow-based | 40.14% |
The EPS payout ratio is relatively high at 79.94%, implying a significant portion of earnings is returned to shareholders, possibly limiting reinvestment capacity. The FCF ratio indicates a more conservative approach.
💸 Cashflow & Capital Efficiency
Evaluating cash flow and capital efficiency provides insights into financial health and operational proficiency. FirstEnergy’s free cash flow yield has shown volatility, whereas capital expenditure aligns with operating cash flow requirements, indicating a balanced but fragile cash flow management system.
| Metric | 2025 | 2024 | 2023 |
|---|---|---|---|
| Free Cash Flow Yield | -3.89% | -4.97% | -9.37% |
| Earnings Yield | 4.92% | 4.28% | 5.25% |
| CAPEX to Operating Cash Flow | 127.16% | 139.39% | 241.96% |
| Stock-based Compensation to Revenue | 0% | 0% | 0% |
| Free Cash Flow / Operating Cash Flow Ratio | -27.16% | -39.39% | -141.96% |
The data suggests that FirstEnergy’s cash flow and capital management require optimization to boost free cash flow yield and enhance reinvestment capacity.
🗣️ Balance Sheet & Leverage Analysis
A strong balance sheet and responsible leverage are vital for financial resilience. Metrics like high debt-to-equity and satisfactory current ratios can signal potential red flags that could affect liquidity and flexibility.
| Metric | 2025 | 2024 | 2023 |
|---|---|---|---|
| Debt-to-Equity | 216.39% | 194.83% | 238.67% |
| Debt-to-Assets | 48.42% | 46.63% | 51.08% |
| Debt-to-Capital | 68.39% | 66.08% | 70.47% |
| Net Debt to EBITDA | 6.15 | 5.89 | 6.27 |
| Current Ratio | 0.57 | 0.56 | 0.48 |
| Quick Ratio | 0.46 | 0.45 | 0.38 |
| Financial Leverage | 4.47 | 4.18 | 4.67 |
The financial leverage is notably high, suggesting careful debt management is required to maintain financial health.
📊 Fundamental Strength & Profitability
High returns on equity and assets generally reflect robust profitability. Nonetheless, only modest margins have been observed, with room for improvement in operational efficiency and margin expansion.
| Metric | 2025 | 2024 | 2023 |
|---|---|---|---|
| Return on Equity | 10.16% | 7.85% | 10.56% |
| Return on Assets | 2.27% | 1.88% | 2.26% |
| Net Margin | 8.42% | 7.26% | 8.56% |
| EBIT Margin | 18.77% | 18.67% | 19.36% |
| EBITDA Margin | 29.08% | 30.46% | 30.71% |
| Gross Margin | 54.77% | 67.52% | 63.90% |
| Research & Development to Revenue | 0% | 0% | 0% |
Fundamental strength is moderate, drawing attention to the need for enhanced profitability and operational metrics.
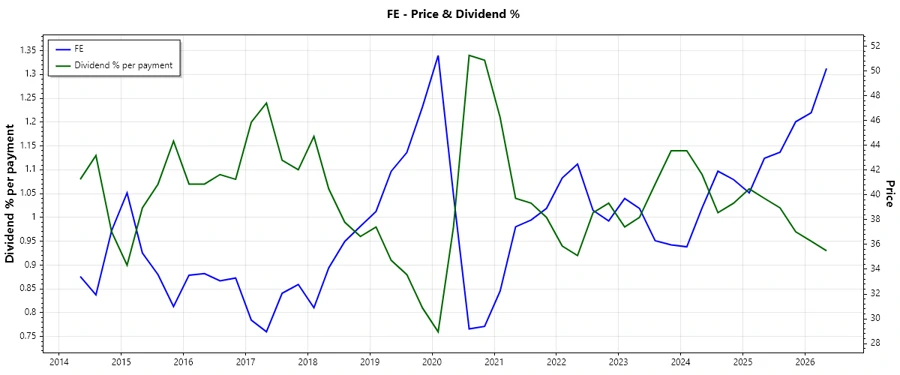
📈 Price Development
📉 Dividend Scoring System
| Criteria | Points | Score |
|---|---|---|
| Dividend yield | 4 | |
| Dividend Stability | 4 | |
| Dividend growth | 3 | |
| Payout ratio | 3 | |
| Financial stability | 3 | |
| Dividend continuity | 4 | |
| Cashflow Coverage | 2 | |
| Balance Sheet Quality | 2 |
Total Score: 25/40
✅ Rating
Based on the analysis, FirstEnergy Corp. presents a reliable dividend yielding opportunity with moderate growth prospects. While the company demonstrates stability in dividend continuity, attention to improving cash flow management and leverage ratios will further solidify this position. Hence, FirstEnergy Corp. holds a 'Hold' recommendation considering balanced potential and risks.
Smart Data Insight
Master the Perfect Entry & Exit for this Stock
Don't leave your profits to chance. Historically, this stock follows specific seasonal patterns that institutional traders use to maximize returns.
- ✅ Identify the "Golden Buying Window"
- ✅ Avoid high-risk correction cycles
- ✅ Backtested data from the last 20+ years