December 31, 2025 a 02:46 am

FE: Dividend Analysis - FirstEnergy Corp.
FirstEnergy Corp. presents a compelling dividend profile with a historically stable payout over 29 years. Despite a notable dividend cut anticipated in 2026, the firm maintains a respectable yield, albeit with a high EPS payout ratio. This careful balancing act between stability and adaptability makes FirstEnergy an intriguing prospect for dividend-focused investors.
📊 Overview
FirstEnergy Corp. exhibits a robust dividend yield of 3.96%, positioning itself in the Utilities sector with a consistent dividend history spanning 29 years. Anticipations include a dividend cut in 2026, reflecting future strategic realignments.
| Metric | Value |
|---|---|
| Sector | Utilities |
| Dividend Yield | 3.96% |
| Current Dividend per Share | 1.69 USD |
| Dividend History | 29 years |
| Last Cut or Suspension | 2026 |
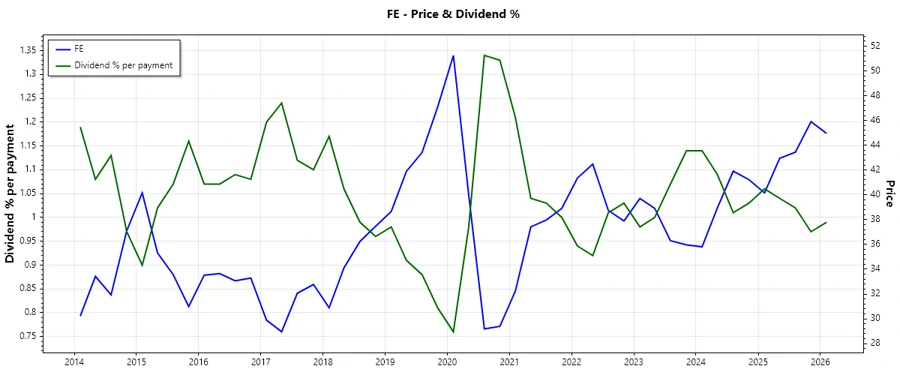
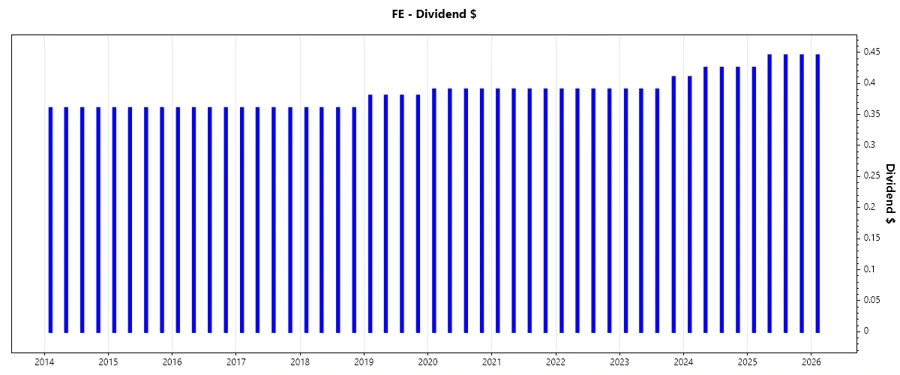
📉 Dividend History
Evaluating past dividends offers critical insights into stability and management's commitment to reward shareholders. It empowers investors to forecast future income streams.
| Year | Dividend per Share (USD) |
|---|---|
| 2026 | 0.445 |
| 2025 | 1.760 |
| 2024 | 1.685 |
| 2023 | 1.58 |
| 2022 | 1.56 |
📈 Dividend Growth
Understanding dividend growth rates is crucial for gauging potential future income. A key indicator of the company's earning potential and financial health.
| Time | Growth |
|---|---|
| 3 years | 2.60% |
| 5 years | 2.08% |
The average dividend growth is 2.08% over 5 years, indicating moderate but steady dividend growth.
✅ Payout Ratio
Payout ratios assess how a firm's net income is distributed as dividends, providing insight into reward sustainability and potential reinvestment.
| Key figure | Ratio |
|---|---|
| EPS-based | 73.57% |
| Free Cash Flow-based | 42.11% |
With an EPS payout ratio of 73.57% and an FCF payout ratio of 42.11%, FirstEnergy shows a commitment to maintaining dividends while allowing room for reinvestment for growth.
⚠️ Cashflow & Capital Efficiency
An analysis of cash flows and capital efficiency highlights a firm's ability to generate cash relative to expenses. It's essential for sustainability and growth investment.
| Metric | 2022 | 2023 | 2024 |
|---|---|---|---|
| Free Cash Flow Yield | -0.30% | -9.37% | -4.98% |
| Earnings Yield | 1.70% | 5.25% | 4.28% |
| CAPEX to Operating Cash Flow | 35.86% | 241.96% | 139.39% |
| Stock-based Compensation to Revenue | 0% | 0% | 0% |
| Free Cash Flow / Operating Cash Flow Ratio | -3.93% | -141.96% | -39.39% |
The stability of FirstEnergy's cash flows is challenging, with high CAPEX impacting free cash flow. However, efficient earnings yields suggest potential improvements ahead in cash management and returns on invested capital.
🗣️ Balance Sheet & Leverage Analysis
A strong balance sheet is vital for assessing a company's capacity to meet short-term liabilities and manage its debt comfortably.
| Metric | 2022 | 2023 | 2024 |
|---|---|---|---|
| Debt-to-Equity | 2.13 | 2.39 | 1.95 |
| Debt-to-Assets | 0.47 | 0.51 | 0.47 |
| Debt-to-Capital | 0.68 | 0.70 | 0.66 |
| Net Debt to EBITDA | 5.70 | 6.27 | 5.68 |
| Current Ratio | 0.61 | 0.48 | 0.55 |
| Quick Ratio | 0.50 | 0.38 | 0.45 |
| Financial Leverage | 4.54 | 4.67 | 4.18 |
FirstEnergy's leverage ratios, with a high debt-to-equity ratio, signal reliance on borrowed funds, which can escalate risk. However, efficient management of liquidity reflects their strategy to strengthen financial resilience.
Profitability & Fundamental Strength
Analyzing profitability measures helps to evaluate the overall efficiency and financial resilience, critical for long-term success.
| Metric | 2022 | 2023 | 2024 |
|---|---|---|---|
| ROE | 3.99% | 10.56% | 7.85% |
| ROA | 0.88% | 2.26% | 1.88% |
| Net Margin | 3.26% | 8.56% | 7.26% |
| EBIT Margin | 19.22% | 19.36% | 18.67% |
| EBITDA Margin | 30.25% | 30.71% | 30.46% |
| Gross Margin | 63.14% | 63.90% | 67.52% |
| R&D to Revenue | 0% | 0% | 0% |
The firm's strong EBITDA and EBIT margins demonstrate solid operational efficiency, translating to improved profitability and promising underlying business health.
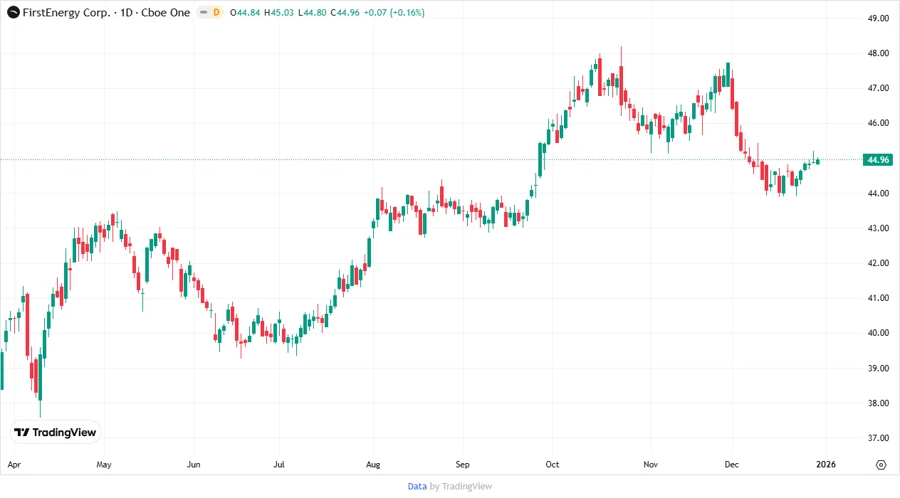
Price Development
🏆 Dividend Scoring System
| Category | Description | Score |
|---|---|---|
| Dividend Yield | Yield percentage related to stock price | |
| Dividend Stability | Consistency and predictability | |
| Dividend Growth | Rate of dividend increase over time | |
| Payout Ratio | Percentage of earnings paid as dividends | |
| Financial Stability | Ability to sustain dividends | |
| Dividend Continuity | Uninterrupted dividend payment history | |
| Cashflow Coverage | Free cash flow coverage for dividends | |
| Balance Sheet Quality | Leverage and liquidity ratios |
Total Score: 37/40
🗒️ Rating
FirstEnergy Corp offers an attractive dividend profile for income-seeking investors, bolstered by historical stability and a commendable yield. While facing future dividend challenges, the overall strong fundamentals and strategic reinvestment potential provide a solid recommendation for a balanced investor portfolio.