August 02, 2025 a 07:46 am


FE: Dividend Analysis - FirstEnergy Corp.
FirstEnergy Corp. presents a robust dividend history with over 28 years of continuous payments. Despite challenges in their financial leverage, the corporation's steady dividend yield of 4.03% and modest growth offer consistent returns to shareholders. However, attention is necessary on the elevated free cash flow payout ratio, signaling potential sustainability concerns in prolonged dividend growth.
📊 Overview
The energy sector is traditionally known for its stable dividends, and FirstEnergy Corp. is a testament to that tradition with an attractive dividend yield.
| Metric | Detail |
|---|---|
| Sector | Utilities |
| Dividend yield | 4.03 % |
| Current dividend per share | 1.69 USD |
| Dividend history | 28 years |
| Last cut or suspension | None |
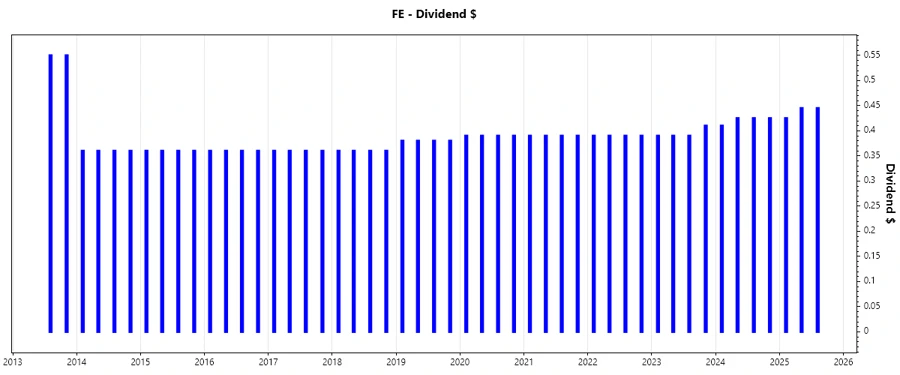
🗣️ Dividend History
The comprehensive dividend history of FirstEnergy demonstrates a commitment to rewarding shareholders, although recent growth is modest, reflecting sector stability.
| Year | Dividend per Share (USD) |
|---|---|
| 2025 | 1.315 |
| 2024 | 1.685 |
| 2023 | 1.58 |
| 2022 | 1.56 |
| 2021 | 1.56 |
📈 Dividend Growth
Analyzing dividend growth is crucial for assessing future potential. Although recent increases are moderate, they indicate a commitment to maintaining shareholder value.
| Time | Growth |
|---|---|
| 3 years | 2.60 % |
| 5 years | 2.08 % |
The average dividend growth is 2.08% over 5 years. This shows moderate but steady dividend growth.
⚠️ Payout Ratio
The payout ratios offer insight into the sustainability of dividends. FirstEnergy's high free cash flow payout ratio suggests potential risk if earnings do not meet expectations.
| Key figure | Ratio |
|---|---|
| EPS-based | 71.68 % |
| Free cash flow-based | 414.49 % |
The 71.68% EPS payout is within healthy limits, but the 414.49% FCF payout is concerning, highlighting insufficient free cash flow for dividend coverage.
✅ Cashflow & Capital Efficiency
Evaluating cash flow is pivotal for assessing operational efficiency and financial health. Here, FirstEnergy shows operational cash flow challenges impacting capital returns.
| Year | 2024 | 2023 | 2022 |
|---|---|---|---|
| Free Cash Flow Yield | -4.98% | -9.37% | -0.30% |
| Earnings Yield | 4.28% | 5.25% | 1.70% |
| CAPEX to Operating Cash Flow | 139.40% | 241.96% | 102.72% |
| Stock-based Compensation to Revenue | 0% | 0% | 0.81% |
| Free Cash Flow / Operating Cash Flow Ratio | -39.40% | -141.96% | -2.72% |
The negative free cash flow yield and high CAPEX/Operating Cash Flow ratio suggest aggressive capital investments that restrict short-term liquidity.
📉 Balance Sheet & Leverage Analysis
Balance sheet stability is essential to support dividends during market fluctuations. Despite robust equity utilization, FirstEnergy's leverage ratios necessitate careful monitoring.
| Year | 2024 | 2023 | 2022 |
|---|---|---|---|
| Debt-to-Equity | 1.93 | 2.39 | 2.13 |
| Debt-to-Assets | 46.16% | 51.08% | 46.96% |
| Debt-to-Capital | 65.86% | 70.47% | 68.05% |
| Net Debt to EBITDA | 5.83 | 6.64 | 6.23 |
| Current Ratio | 0.021 | 0.477 | 0.610 |
| Quick Ratio | 0.446 | 0.382 | 0.504 |
| Financial Leverage | 4.18 | 4.67 | 4.54 |
The leverage analysis underlines elevated debt levels relative to equity and assets, emphasizing the necessity for operational profitability to maintain financial health.
✅ Fundamental Strength & Profitability
Profitability ratios are a window into operational success and sustainability.
| Year | 2024 | 2023 | 2022 |
|---|---|---|---|
| Return on Equity | 7.85% | 10.56% | 3.99% |
| Return on Assets | 1.88% | 2.26% | 0.88% |
| Net Margin | 7.26% | 8.56% | 3.26% |
| EBIT Margin | 18.67% | 19.65% | 19.22% |
| EBITDA Margin | 30.46% | 28.97% | 27.70% |
| Gross Margin | 67.52% | 63.90% | 63.13% |
| R&D to Revenue | 0% | 0% | 0% |
While profitability margins ensure operational success, the improvements in return on equity highlight positive performance growth efforts.
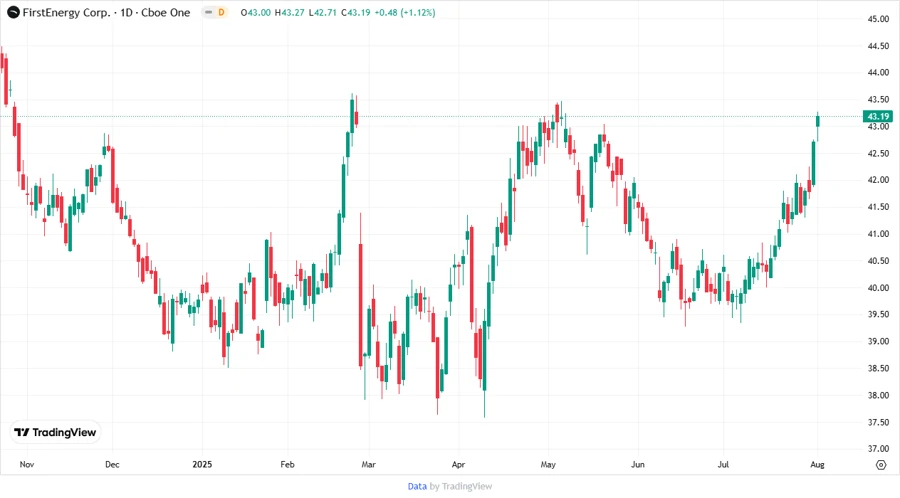
📈 Price Development
🏆 Dividend Scoring System
An effective scoring system provides insights into dividend performance and potential risks.
| Category | Score (out of 5) | Score Bar |
|---|---|---|
| Dividend yield | 4 | |
| Dividend Stability | 5 | |
| Dividend Growth | 3 | |
| Payout Ratio | 2 | |
| Financial Stability | 2 | |
| Dividend Continuity | 5 | |
| Cashflow Coverage | 1 | |
| Balance Sheet Quality | 3 |
Total Score: 25/40
Final Rating
FirstEnergy Corp. maintains a solid dividend profile with dependable yield and history. However, due to challenges in financial leverage and cash coverage, investors should exercise caution and closely monitor financial performance for sustainable dividend continuity.
Smart Data Insight
Master the Perfect Entry & Exit for this Stock
Don't leave your profits to chance. Historically, this stock follows specific seasonal patterns that institutional traders use to maximize returns.
- ✅ Identify the "Golden Buying Window"
- ✅ Avoid high-risk correction cycles
- ✅ Backtested data from the last 20+ years