March 21, 2026 a 05:15 am
FDX: Fibonacci Analysis - FedEx Corporation
The FedEx Corporation's stock (FDX) has experienced significant movements in the past months. With the challenges posed by global supply chain disruptions and increasing e-commerce demands, the stock has seen volatile fluctuations. The analysis below provides insight into the stock's current technical positioning, employing Fibonacci retracement to determine potential support and resistance levels.
Fibonacci Analysis
| Detail | Value |
|---|---|
| Trend Start Date | 2025-11-10 |
| Trend End Date | 2026-03-20 |
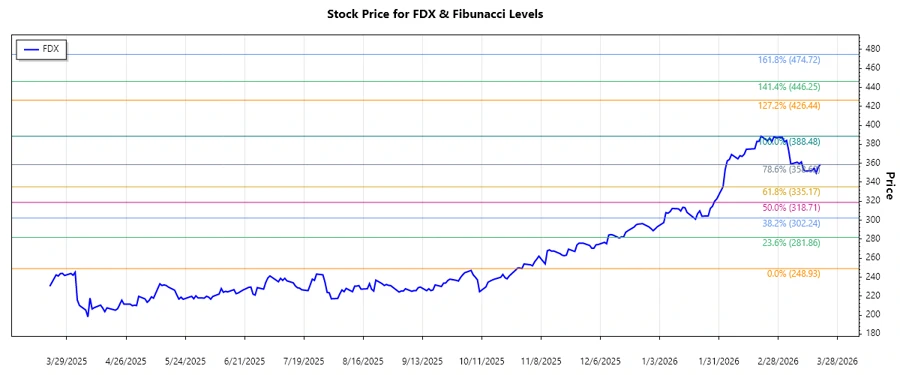
| High Price | $388.48 (2026-02-20) |
| Low Price | $248.93 (2025-10-30) |
| Fibonacci Levels |
|
| Current Price | $358.85 |
| Retracement Zone | 0.5 |
| Interpretation | The current price of $358.85 is situated within the 0.5 Fibonacci retracement level, suggesting a potential support zone for the stock. If this level holds, a further upward movement might be anticipated; otherwise, a breakdown could test lower Fibonacci levels. |
Conclusion
The FedEx Corporation has experienced an impressive upward trend in recent months, reflected by its highs and lows and confirmed by the Fibonacci analysis. While FDX has potential for growth, especially if the stock maintains its current support level at the 0.5 retracement, the potential risks due to market uncertainties shouldn't be ignored. A careful observation of its positioning within the Fibonacci levels would serve investors well in gauging potential pullbacks or continued bullish strength. Analysts will closely watch for changes in FedEx's operational efficiencies and response to global logistical demands as factors that may further influence stock dynamics.