May 20, 2026 a 07:31 am
FDX: Dividend Analysis - FedEx Corporation
FedEx Corporation, a leader in the transportation and e-commerce solutions sector, has demonstrated consistent dividend payment trends over the years. With a market capitalization of approximately $89.47 billion, its dividend profile shows a modest yield, yet a considerable history of growth. The current financial health suggests potential investment stability, though scrutiny over payout sustainability remains crucial for long-term investors.
📊 Overview
FedEx Corporation operates within the transport sector, exhibiting a commendable track record of consistent dividend payments spanning 25 years, indicating solid financial management and shareholder commitment. However, the recent yield of 1.61% prompts investors to consider growth potential and industry benchmarks for strategic positioning.
| Key Metric | Value |
|---|---|
| Sector | Transportation |
| Dividend yield | 1.61 % |
| Current dividend per share | 5.51 USD |
| Dividend history | 25 years |
| Last cut or suspension | None |
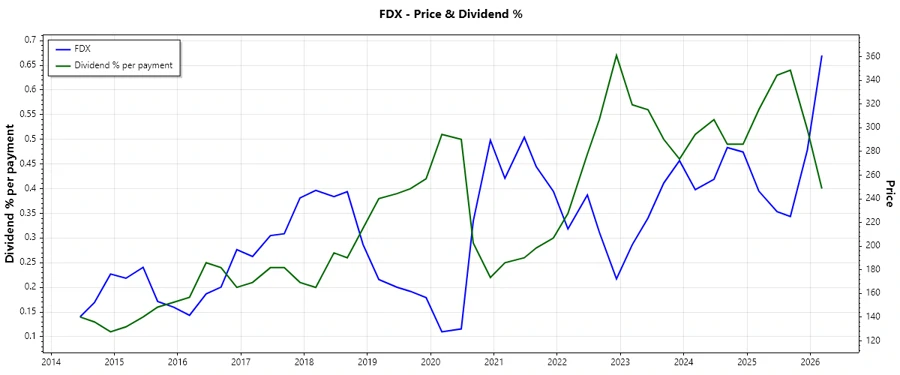
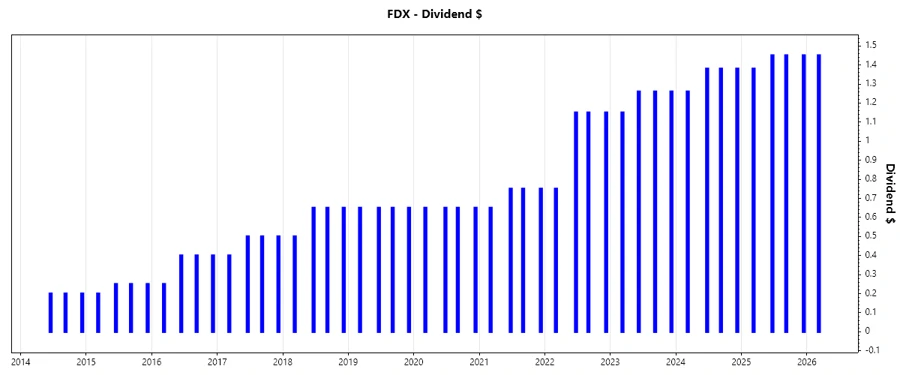
🗣️ Dividend History
Examining FedEx's dividend trajectory reveals a robust growth pattern, providing investors with foresight into earnings reliability and management's strategic approach towards equity returns. This history underpins the corporation’s commitment to rewarding long-term shareholders.
| Year | Dividend Per Share (USD) |
|---|---|
| 2026 | 1.45 |
| 2025 | 5.73 |
| 2024 | 5.40 |
| 2023 | 4.93 |
| 2022 | 4.20 |
📈 Dividend Growth
The dividend growth rate is pivotal for assessing the compounding revenue potential for shareholders. FedEx's growth at 10.91% over three years and 17.12% over five years reflects an inclination towards sustainable income increment strategies.
| Time | Growth |
|---|---|
| 3 years | 10.91 % |
| 5 years | 17.12 % |
The average dividend growth is 17.12% over 5 years. This shows moderate but steady dividend growth.
📉 Payout Ratio
Payout ratios are analytical hallmarks for dividend sustainability. FedEx maintains a payout ratio of 29.86% (EPS-based) and 30.08% (FCF-based), indicating robust earnings conversion while allowing reserve capitalization for future endeavors.
| Key figure | Ratio |
|---|---|
| EPS-based | 29.86 % |
| Free cash flow-based | 30.08 % |
This suggests a healthy payout framework, ensuring long-term dividend viability without over-leveraging company resources.
✅ Cashflow & Capital Efficiency
Analyzing cash flow efficiency provides insight into operational vitality and capital allocation effectiveness. The historical data underscores FedEx's adept management in maintaining favorable returns on invested capital (ROIC) and healthy cash flow metrics, reflecting financial resilience.
| Year | 2025 | 2024 | 2023 |
|---|---|---|---|
| Free Cash Flow Yield | 5.62% | 4.98% | 4.77% |
| Earnings Yield | 7.72% | 6.88% | 7.17% |
| CAPEX / Operating Cash Flow | 57.63% | 62.27% | 70.04% |
| Stock-based Compensation / Revenue | 0.18% | 0.19% | 0.20% |
| Free Cash Flow / Operating Cash Flow Ratio | 42.37% | 37.73% | 29.96% |
These figures highlight FedEx's capital efficiency, supporting strategic investments while addressing dividend commitments.
⚠️ Balance Sheet & Leverage Analysis
Balance sheet scrutiny reveals leverage risks and liquidity buffers. FedEx's debt-to-equity and current ratios illustrate a well-calibrated approach to funding operational activities, ensuring sufficient liquidity amidst strategic debt loads.
| Year | 2025 | 2024 | 2023 |
|---|---|---|---|
| Debt-to-Equity | 1.33 | 1.37 | 1.47 |
| Debt-to-Assets | 42.70% | 43.35% | 44.00% |
| Debt-to-Capital | 57.13% | 57.76% | 59.50% |
| Net Debt to EBITDA | 3.04 | 2.87 | 3.08 |
| Current Ratio | 1.19 | 1.36 | 1.37 |
| Quick Ratio | 1.15 | 1.32 | 1.32 |
FedEx displays a balanced leverage structure, pointing to efficient asset utilization and strategic debt management.
✅ Fundamental Strength & Profitability
Evaluating profit margins and returns indicates operational prowess and market leverage. FedEx’s ROE and diverse margin ratios manifest competitive strengths, underscoring its capacity for reinvestment and shareholder value creation.
| Year | 2025 | 2024 | 2023 |
|---|---|---|---|
| Return on Equity | 14.58% | 15.70% | 15.23% |
| Return on Assets | 4.67% | 4.98% | 4.56% |
| Net Margin | 4.65% | 4.94% | 4.41% |
| EBIT Margin | 7.09% | 7.50% | 6.72% |
| EBITDA Margin | 11.94% | 12.39% | 11.35% |
| Gross Margin | 21.60% | 21.61% | 21.26% |
The profitability indices suggest solid performance, fortifying FedEx's fiscal foundation and competitive market stance.
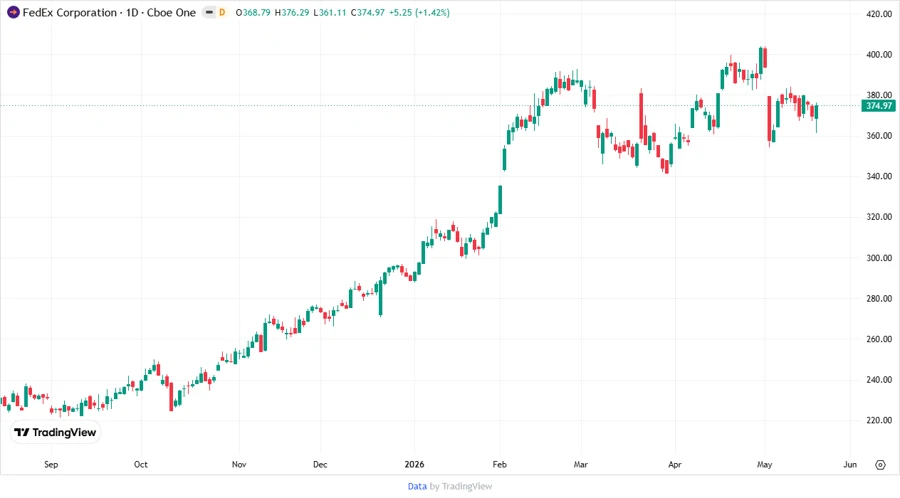
Price Development
🎯 Dividend Scoring System
| Category | Score (1-5) | Score Bar |
|---|---|---|
| Dividend yield | 3 | |
| Dividend Stability | 5 | |
| Dividend growth | 4 | |
| Payout ratio | 5 | |
| Financial stability | 4 | |
| Dividend continuity | 5 | |
| Cashflow Coverage | 4 | |
| Balance Sheet Quality | 4 |
Total Score: 34/40
💡 Rating
FedEx Corporation showcases a robust financial framework with a commendable dividend history and sustainable growth pathway. Its competitive edge is defined by sound financial management and efficient capital allocation, providing substantial long-term investment value. Investors might consider FedEx as a stable dividend asset, well-suited for those seeking reliable income prospects within the logistics and transportation sectors.
Smart Data Insight
Master the Perfect Entry & Exit for this Stock
Don't leave your profits to chance. Historically, this stock follows specific seasonal patterns that institutional traders use to maximize returns.
- ✅ Identify the "Golden Buying Window"
- ✅ Avoid high-risk correction cycles
- ✅ Backtested data from the last 20+ years