January 25, 2026 a 07:46 am
FDX: Dividend Analysis - FedEx Corporation
FedEx Corporation is a notable player in the logistics sector, delivering sound dividend returns and long-term growth. With a steady dividend history of 24 years and a current yield of 2.04%, the company's commitment to shareholder returns is evident. However, investors should monitor the payout ratios alongside financial stability metrics to ensure continuous and sustainable dividends.
📊 Overview
FedEx operates within the logistics sector, boasting a resilient dividend yield of 2.04%. With a current dividend per share at $5.51 and an impressive 24-year history, FedEx has shown reliability in shareholder returns. Despite market fluctuations, the absence of any recent cuts or suspensions highlights the company's robust dividend strategy.
| Parameter | Value |
|---|---|
| Sector | Logistics |
| Dividend yield | 2.0375% |
| Current dividend per share | $5.51 |
| Dividend history | 24 years |
| Last cut or suspension | None |
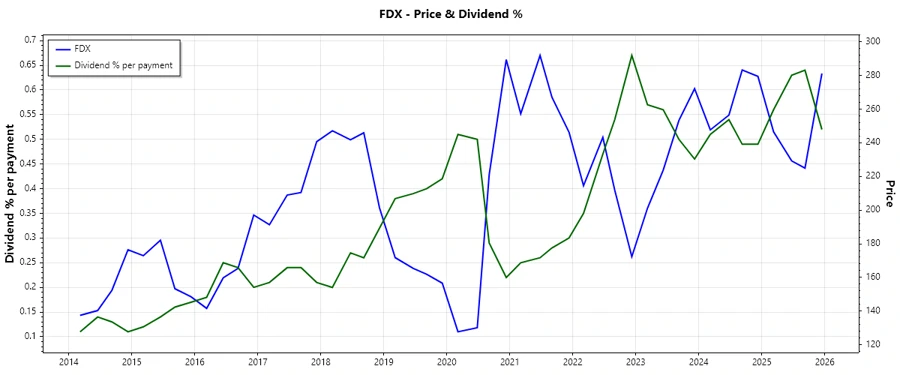
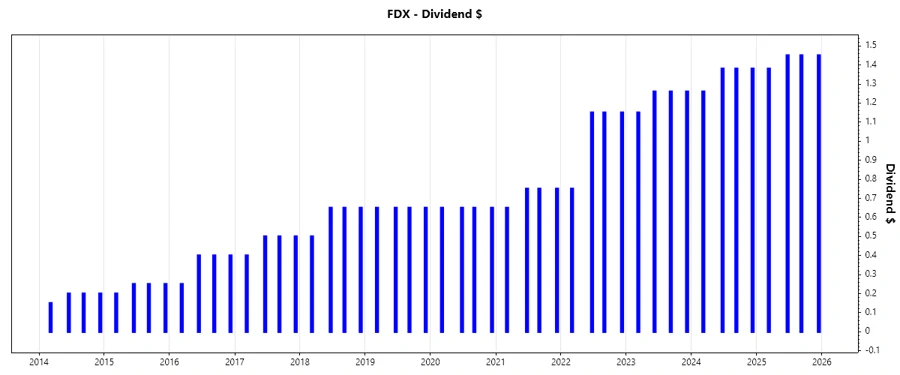
📈 Dividend History
Examining FedEx's dividend history reveals a strong commitment to increasing shareholder values over the years. This consistency is a testament to the company's financial health and its prioritization of shareholder returns.
| Year | Dividend per share (USD) |
|---|---|
| 2025 | $5.73 |
| 2024 | $5.40 |
| 2023 | $4.93 |
| 2022 | $4.20 |
| 2021 | $2.90 |
📈 Dividend Growth
The historical dividend growth of FedEx demonstrates its dedication to increasing returns. This growth provides a crucial insight into future potential increase in dividends and investor confidence.
| Time | Growth |
|---|---|
| 3 years | 10.91% |
| 5 years | 17.12% |
The average dividend growth is 17.12% over 5 years. This shows moderate but steady dividend growth.
💼 Payout Ratio
Analyzing payout ratios offers insights into the sustainability of the dividend. FedEx's payout ratios align well with its operational performance and provide comfort regarding continued dividend payouts.
| Ratio Type | Value |
|---|---|
| EPS-based | 30.87% |
| Free cash flow-based | 29.90% |
A payout ratio of 30.87% (EPS) and 29.90% (FCF) indicate prudent financial management, ensuring dividends remain manageable and do not overly strain the company’s resources.
💸 Cashflow & Capital Efficiency
Cashflow and capital efficiency metrics are crucial in assessing whether a company can sustain and grow its dividends. Through these lenses, FedEx illustrates a stable cashflow framework and effective use of capital.
| Year | 2023 | 2024 | 2025 |
|---|---|---|---|
| Free Cash Flow Yield | 4.77% | 4.98% | 5.62% |
| Earnings Yield | 7.17% | 6.88% | 7.72% |
| CAPEX to Operating Cash Flow | 70.04% | 62.27% | 57.63% |
| Stock-based Compensation to Revenue | 0.20% | 0.19% | 0.18% |
| Free Cash Flow / Operating Cash Flow Ratio | 29.96% | 37.73% | 42.37% |
FedEx demonstrates strong cashflow stability and efficient capital use, indicating a solid financial foundation to support ongoing dividends.
💪 Balance Sheet & Leverage Analysis
Balance sheet strength and leverage analysis provide insights into the financial health and risk profile of FedEx, which impacts its dividend-paying capability.
| Year | 2023 | 2024 | 2025 |
|---|---|---|---|
| Debt-to-Equity | 146.93% | 136.75% | 133.28% |
| Debt-to-Assets | 44.00% | 43.35% | 42.70% |
| Debt-to-Capital | 59.50% | 57.76% | 57.13% |
| Net Debt to EBITDA | 3.08 | 2.87 | 3.04 |
| Current Ratio | 1.37 | 1.36 | 1.19 |
| Quick Ratio | 1.32 | 1.32 | 1.15 |
| Financial Leverage | 3.34 | 3.15 | 3.12 |
FedEx maintains balanced leverage and stable financial ratios, underscoring its capability to manage debt and support dividend payouts effectively.
📊 Fundamental Strength & Profitability
Fundamental strength and profitability play a pivotal role in assessing a company’s ability to fund dividends through operational success and efficiency.
| Year | 2023 | 2024 | 2025 |
|---|---|---|---|
| Return on Equity | 15.23% | 15.70% | 14.58% |
| Return on Assets | 4.56% | 4.98% | 4.67% |
| Return on Invested Capital | 5.20% | 6.19% | 6.00% |
| Net Margin | 4.41% | 4.94% | 4.65% |
| EBIT Margin | 6.72% | 7.50% | 7.09% |
| EBITDA Margin | 11.35% | 12.39% | 11.94% |
| Gross Margin | 21.26% | 21.61% | 21.60% |
| Research & Development to Revenue | 0 | 0 | 0 |
FedEx’s profitability metrics corroborate its operational prowess, ensuring adequate profitability to support sustainable dividends.
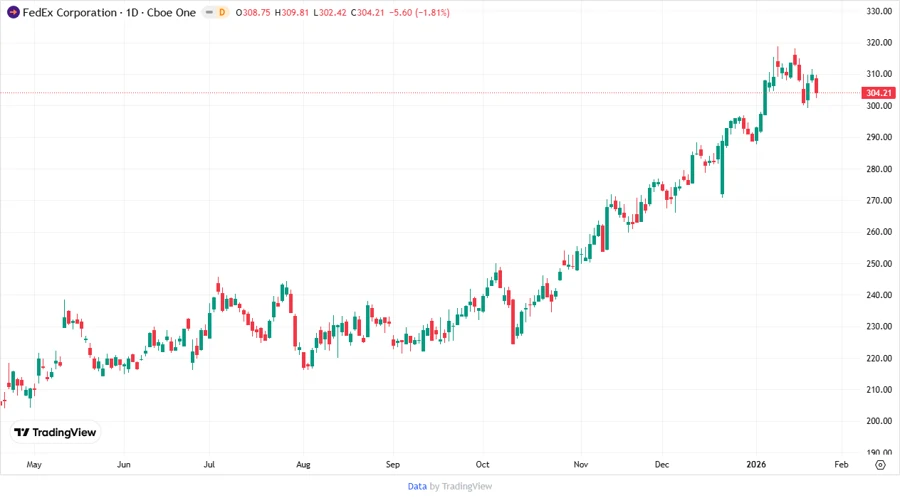
📈 Price Development
🎯 Dividend Scoring System
| Category | Score | Bar |
|---|---|---|
| Dividend yield | 3 | |
| Dividend Stability | 5 | |
| Dividend growth | 4 | |
| Payout ratio | 4 | |
| Financial stability | 4 | |
| Dividend continuity | 5 | |
| Cashflow Coverage | 5 | |
| Balance Sheet Quality | 4 |
Overall Score: 34/40
⭐ Rating
FedEx Corporation demonstrates a robust dividend profile characterized by stability, growth, and financial integrity. Its solid historical performance and strategic financial management make it a compelling choice for dividend-oriented investors seeking reliability and moderate capital appreciation potential. We recommend considering FedEx as a part of a diversified dividend-focused portfolio.