September 02, 2025 a 03:31 am

FDX: Dividend Analysis - FedEx Corporation
FedEx Corporation presents a compelling case for dividend investors due to its strong history of payouts and its strategic position in the logistics sector. Consistent dividends over 24 years underscore the company's stable earnings and commitment to shareholder returns. Despite recent challenges in global supply chains, FedEx has shown resilience, maintaining a prudent payout ratio which ensures sustainable future distributions. Investors may find FedEx's mix of modest dividend yield and growth potential particularly appealing.
📊 Overview
FedEx operates in the logistics sector, offering a dividend yield of 2.45%, which is attractive given the industry's capital-intensive nature. With a current dividend per share of $5.51, FedEx has maintained dividends consistently for the past 24 years, with no cuts or suspensions, reinforcing investor trust.
| Sector | Dividend Yield | Current Dividend Per Share | Dividend History | Last Cut or Suspension |
|---|---|---|---|---|
| Logistics | 2.45% | $5.51 | 24 years | None |
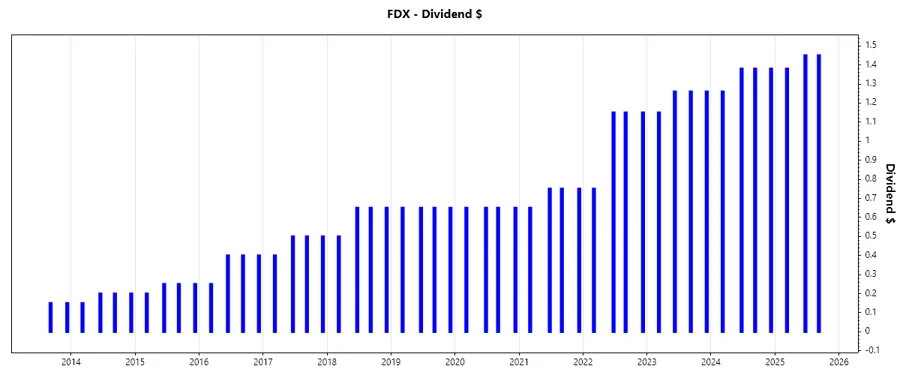
🗣️ Dividend History
FedEx's dividend history is a testament to its strong operational performance and commitment to returning value to shareholders. The longevity of its dividend history, spanning over two decades, underscores its resilience and financial stability. Consistency in payouts provides confidence in FedEx's ability to sustain dividends even in challenging times.
| Year | Dividend per Share (USD) |
|---|---|
| 2025 | 4.28 |
| 2024 | 5.40 |
| 2023 | 4.93 |
| 2022 | 4.20 |
| 2021 | 2.90 |
📈 Dividend Growth
Evaluating the dividend growth rate over three and five years is critical as it provides insights into the company's ability to increase shareholder returns sustainably. The moderate dividend growth reflects FedEx's strategic focus on maintaining balanced capital allocation between return enhancements and growth investments.
| Time | Growth |
|---|---|
| 3 years | 23.03% |
| 5 years | 15.74% |
The average dividend growth is 15.74% over 5 years. This shows moderate but steady dividend growth, indicating a balance between reinvestment in business operations and enhancing shareholder value.
📉 Payout Ratio
The payout ratio is a crucial indicator of dividend sustainability. FedEx's EPS-based payout ratio of 32.05% and FCF-based ratio of 43.61% suggest a conservative payout strategy, ensuring sufficient earnings and cash flow retention for future growth and challenging periods.
| Key Figure | Ratio |
|---|---|
| EPS-based | 32.05% |
| Free Cash Flow-based | 43.61% |
The payout ratios are indicative of FedEx's ability to maintain its dividend distributions without over-leveraging itself, striking a prudent balance between dividend payouts and company reinvestment needs.
✅ Cashflow & Capital Efficiency
Analyzing cash flow efficiency and capital deployment strategies provides insights into the company's financial health and operational efficiency. Metrics like Free Cash Flow Yield, Earnings Yield, and CAPEX to Operating Cash Flow inform on liquidity and potential for growth investments.
| Metric | 2023 | 2024 | 2025 |
|---|---|---|---|
| Free Cash Flow Yield | 4.77% | 4.98% | 5.62% |
| Earnings Yield | 7.17% | 6.88% | 7.72% |
| CAPEX to Operating Cash Flow | 70.04% | 62.27% | 57.63% |
| Stock-based Compensation to Revenue | 0.20% | 0.19% | 0.18% |
| Free Cash Flow / Operating Cash Flow Ratio | 29.96% | 37.73% | 42.37% |
These metrics reflect FedEx's effective cash management and robust liquidity position, providing flexibility in capital allocation for future expansion and shareholder returns.
⚠️ Balance Sheet & Leverage Analysis
Assessing leverage and financial ratios helps understand the company's solvency and risk. A healthy balance sheet ensures sustainability and the ability to weather adverse economic conditions.
| Metric | 2023 | 2024 | 2025 |
|---|---|---|---|
| Debt-to-Equity | 1.47 | 1.37 | 1.33 |
| Debt-to-Assets | 44.00% | 43.35% | 42.70% |
| Debt-to-Capital | 59.50% | 57.76% | 57.13% |
| Net Debt to EBITDA | 3.08 | 2.87 | 3.15 |
| Current Ratio | 1.37 | 1.36 | 1.19 |
| Quick Ratio | 1.32 | 1.32 | 1.15 |
FedEx's leverage metrics indicate a balanced approach in managing debt, which enhances financial flexibility and capital access for operational needs and growth opportunities.
Profitability & Operational Performance 🤑
The strength of FedEx’s profitability measures reflects its success in executing its operational strategy. High returns on equity and assets signal efficient management of resources and robust operations.
| Metric | 2023 | 2024 | 2025 |
|---|---|---|---|
| Return on Equity | 15.23% | 15.70% | 14.58% |
| Return on Assets | 4.56% | 4.98% | 4.67% |
| Return on Invested Capital | 5.20% | 6.19% | 6.00% |
| Net Margin | 4.41% | 4.93% | 4.65% |
| EBIT Margin | 6.72% | 7.50% | 6.67% |
| EBITDA Margin | 11.35% | 12.39% | 11.52% |
| Gross Margin | 21.26% | 21.61% | 21.60% |
| R&D to Revenue | 0.00% | 0.00% | 0.00% |
The consistent profitability and operational metrics reflect strong management practices and the potential to maintain competitive advantage and shareholder returns.
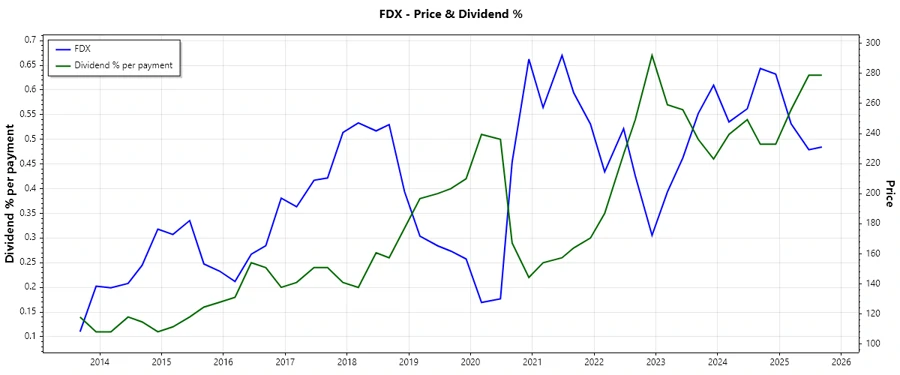
📈 Price Development
Dividend Scoring System 💯
| Category | Score | Visualization |
|---|---|---|
| Dividend Yield | 3 | |
| Dividend Stability | 5 | |
| Dividend Growth | 4 | |
| Payout Ratio | 4 | |
| Financial Stability | 3 | |
| Dividend Continuity | 5 | |
| Cashflow Coverage | 4 | |
| Balance Sheet Quality | 4 |
Total Score: 32/40
🔍 Rating
FedEx Corporation presents a robust dividend profile, characterized by its consistency and moderate growth. The combination of stable financial ratios, effective management, and a strong market position in logistics supports a favorable outlook. Investors seeking a balanced approach to yield and growth might find FedEx an attractive opportunity, underpinned by its strategic resilience and solid earnings base. Recommended for those looking for reliable dividend income with room for capital appreciation.
Smart Data Insight
Master the Perfect Entry & Exit for this Stock
Don't leave your profits to chance. Historically, this stock follows specific seasonal patterns that institutional traders use to maximize returns.
- ✅ Identify the "Golden Buying Window"
- ✅ Avoid high-risk correction cycles
- ✅ Backtested data from the last 20+ years