June 25, 2026 a 02:03 pm

FDXF: Trend and Support & Resistance Analysis - FedEx Freight Holding Company, Inc.
The stock of FedEx Freight Holding Company, Inc. (FDXF) has shown significant volatility over the past few months, driven by changing market conditions and investor sentiment. Despite separating from FedEx Corporation, the company has established itself as a formidable independent entity in the transport sector. A careful examination of recent trends reveals key insights into future price movements that can be crucial for potential investors and analysts alike.
Trend Analysis
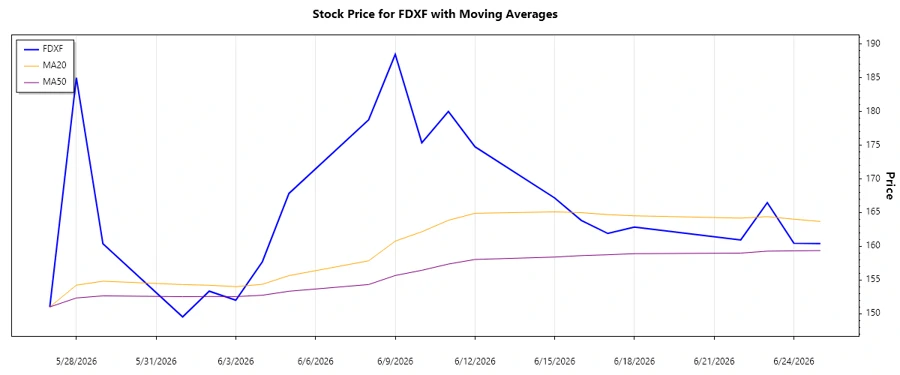
The historical data analysis reveals that the recent trend in the stock price of FDXF is demonstrating mixed signals of both bullish and bearish patterns, with significant fluctuations amidst broader market conditions. The comparison of the exponential moving averages (EMAs) indicates an emerging trend. Below is a summary table reflecting the most recent data:
| Date | Closing Price ($) | Trend |
|---|---|---|
| 2026-06-25 | 160.41 | ▲ Upward |
| 2026-06-24 | 160.45 | ▼ Downward |
| 2026-06-23 | 166.47 | ▲ Upward |
| 2026-06-22 | 160.94 | ▼ Downward |
| 2026-06-18 | 162.85 | ▲ Upward |
| 2026-06-17 | 161.90 | ▼ Downward |
| 2026-06-16 | 163.84 | ▲ Upward |
The EMA analysis indicates a potential bullish sentiment as EMA20 is close to converging with EMA50, pointing towards an ▲ Uptrend. This suggests a cautious optimism for investors.
Support and Resistance
An assessment of support and resistance levels reveals critical price zones which may influence future price action. Below are the calculations and current positioning within these zones:
| Zone | From ($) | To ($) |
|---|---|---|
| Support 1 | 152.00 | 157.00 |
| Support 2 | 159.00 | 162.00 |
| Resistance 1 | 166.00 | 170.00 |
| Resistance 2 | 175.00 | 180.00 |
Currently, the price is close to the lower part of the first resistance zone. An upward breakthrough could suggest further bullish momentum.
Conclusion
FedEx Freight Holding Company, Inc. experiences dynamic market conditions indicative of both risk and opportunity. The EMA and price movements depict a potential leaning towards an upward trend, yet with notable resistance near current levels. Analysts should keep an eye on breaking above resistance levels for a confirmed bullish trend. Conversely, any failure to break through might witness a retraction into support zones and further consolidation. The intricate balance between transit service efficiency and market dynamics requires thorough observation.
json This analysis provides a succinct view of the stock's current standing, considering existing support and resistance levels and recent trend direction based on computed moving averages.
Smart Data Insight
Master the Perfect Entry & Exit for this Stock
Don't leave your profits to chance. Historically, this stock follows specific seasonal patterns that institutional traders use to maximize returns.
- ✅ Identify the "Golden Buying Window"
- ✅ Avoid high-risk correction cycles
- ✅ Backtested data from the last 20+ years