
July 14, 2026 a 03:15 pm
FCX: Fibonacci Analysis - Freeport-McMoRan Inc.
Freeport-McMoRan Inc., a major player in the mining industry, has seen varying economic impacts due to fluctuating commodity prices and geopolitical factors. The analysis is crucial as FCX navigates a volatile market environment, influencing both its immediate and long-term financial strategies. Investors should remain aware of the potent risks and potential opportunities within the company's diverse asset portfolio.
Fibonacci Analysis
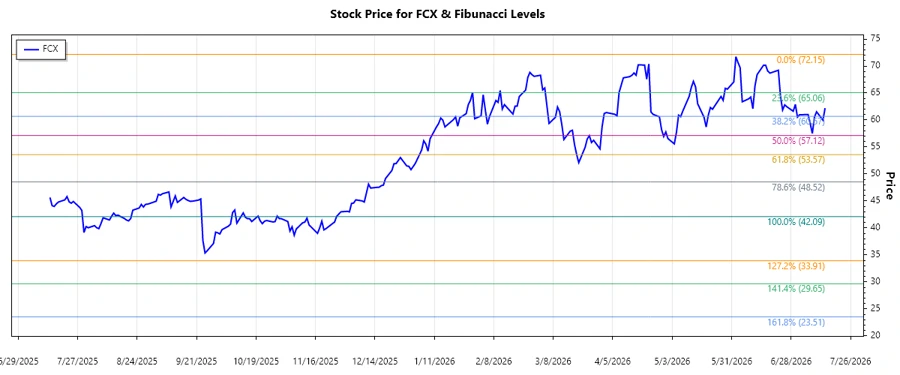
The analysis indicates a downward trend for Freeport-McMoRan Inc. over the examined period. The Fibonacci retracement levels provide insight where potential support and resistance areas may occur during this downward movement. Based on the calculations, the retracement levels are as follows:
| Metric | Value |
|---|---|
| Trend Start Date | 2025-10-13 |
| Trend End Date | 2026-07-14 |
| High Price (Date) | $72.15 (2025-10-13) |
| Low Price (Date) | $42.09 (2026-07-12) |
| Fibonacci Level 0.236 | $48.18 |
| Fibonacci Level 0.382 | $52.09 |
| Fibonacci Level 0.5 | $57.12 |
| Fibonacci Level 0.618 | $61.86 |
| Fibonacci Level 0.786 | $67.74 |
The current stock price is within the 0.382 Fibonacci retracement area, which suggests potential short-term support. This can be interpreted as a possible consolidation point before any further movement, indicating a balancing point for the market sentiment.
Conclusion
Freeport-McMoRan Inc.'s stock is currently navigating a challenging period with both opportunities and risks. The retracement levels suggest key areas where support could hold, offering potential buying conditions for bullish investors. However, breaking below these supports could signal further declines. Investors should keep a close watch on external economic factors like commodity prices and geopolitical events, which may heavily influence the stock's future movements.
Smart Data Insight
Master the Perfect Entry & Exit for this Stock
Don't leave your profits to chance. Historically, this stock follows specific seasonal patterns that institutional traders use to maximize returns.
- ✅ Identify the "Golden Buying Window"
- ✅ Avoid high-risk correction cycles
- ✅ Backtested data from the last 20+ years