
June 29, 2026 a 06:44 am
FCX: Fibonacci Analysis - Freeport-McMoRan Inc.
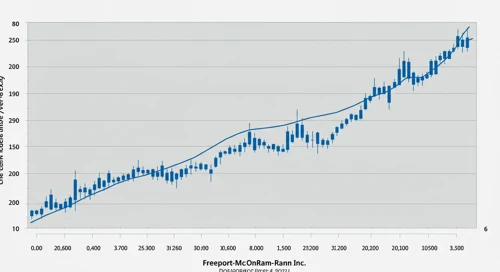
The stock of Freeport-McMoRan Inc. has experienced a significant bullish trend from late November 2025 to mid-June 2026. This mining enterprise has benefited from a rise in the demand for copper and other essential minerals, driving its stock upward. The company’s diverse asset portfolio, including notable sites in Indonesia and the U.S., provides strong support for this positive movement.
Fibonacci Analysis
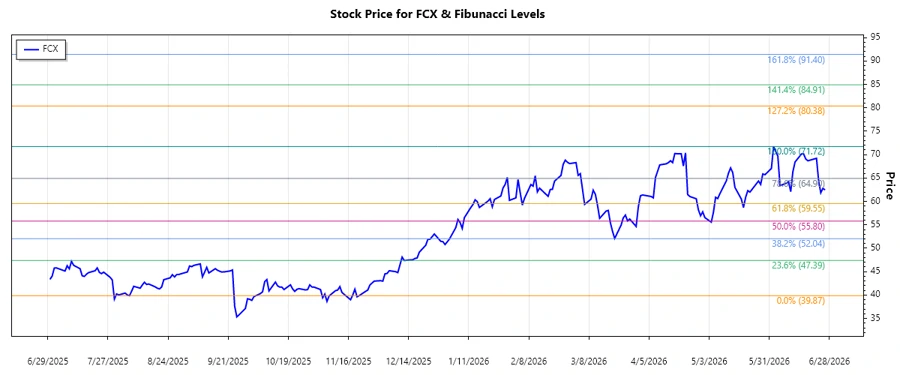
Based on the historical data, an upward trend is identified from November 21, 2025, with a low price of $39.87, reaching a peak at $71.72 on June 2, 2026. The ongoing analysis utilizes these points to calculate potential retracement levels.
| Detail | Information |
|---|---|
| Start Date | 2025-11-21 |
| End Date | 2026-06-02 |
| High Point | $71.72 (2026-06-02) |
| Low Point | $39.87 (2025-11-21) |
Fibonacci Retracement Levels
| Level | Price |
|---|---|
| 0.236 | $62.02 |
| 0.382 | $56.97 |
| 0.5 | $55.79 |
| 0.618 | $54.61 |
| 0.786 | $53.18 |
The current price of $62.45 places the stock within the 0.236 retracement zone, indicating a potential support level. Analysts may view this as a temporary pullback within an ongoing upward trajectory.
Conclusion
Freeport-McMoRan Inc.'s upward trend reflects its strategic operations and growing demand for mineral resources. The retracement levels suggest potential areas of support, bolstering confidence in its long-term ascent. However, external factors like market volatility and global economic conditions could impact this trajectory. Analysts should weigh these factors effectively. Overall, FCX exhibits resilience and ample growth opportunities, but investors should remain vigilant for any signs of trend reversal or broader market shifts.
Smart Data Insight
Master the Perfect Entry & Exit for this Stock
Don't leave your profits to chance. Historically, this stock follows specific seasonal patterns that institutional traders use to maximize returns.
- ✅ Identify the "Golden Buying Window"
- ✅ Avoid high-risk correction cycles
- ✅ Backtested data from the last 20+ years