May 06, 2026 a 07:46 am


FCX: Dividend Analysis - Freeport-McMoRan Inc.
Freeport-McMoRan Inc. (FCX) maintains a robust dividend profile with a history of 25 consecutive years of dividend payments. However, the recent growth rates have shown modest improvements, indicating a need for strategic investment and operational adjustments to enhance shareholder value. The company's dedication to returning capital to shareholders is evident, yet the static growth over three and five years suggests potential areas for strategic risk and opportunities.
📊 Overview
For a comprehensive understanding of Freeport-McMoRan Inc.'s current position in the market, we examine key metrics in the company's financial structure and dividend policies. The company primarily operates in the materials sector, which influences its strategic priorities and dividend responsiveness to market conditions.
| Metric | Value |
|---|---|
| Sector | Materials |
| Dividend Yield | 0.87% |
| Current Dividend per Share | 0.60 USD |
| Dividend History | 25 years |
| Last Cut or Suspension | None |
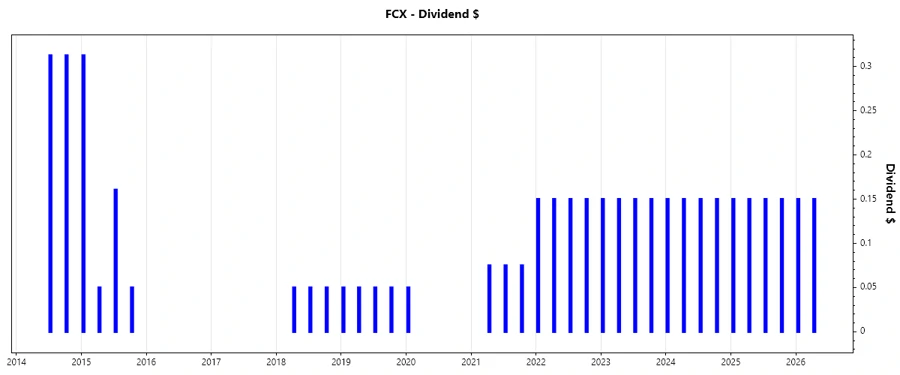
📈 Dividend History
Freeport-McMoRan Inc. has shown a resilient ability to distribute dividends consistently, which enhances investor confidence. Examining historical dividends reveals the company's commitment to shareholder returns, yet recent stagnation suggests opportunities for strategic growth leveraging current market dynamics.
| Year | Dividend per Share (USD) |
|---|---|
| 2026 | 0.30 |
| 2025 | 0.60 |
| 2024 | 0.60 |
| 2023 | 0.60 |
| 2022 | 0.60 |
📊 Dividend Growth
The growth trajectory of dividends over the past three and five years highlights the company's strategic orientation towards stable but modest dividend increases. This growth is essential as it not only impacts current shareholder value but also draws potential investors seeking reliable income streams.
| Time | Growth |
|---|---|
| 3 years | 0% |
| 5 years | 0.64% |
The average dividend growth is 0.64% over 5 years. This shows moderate but steady dividend growth.
📉 Payout Ratio
The payout ratio is a critical indicator of a company's ability to maintain its dividend policy. Freeport-McMoRan Inc.'s current payout ratios show thoughtful balance, enabling sustainable dividends while retaining earnings for reinvestment.
| Key Figure | Ratio |
|---|---|
| EPS-based | 31.67% |
| Free Cash Flow-based | 14.73% |
The company maintains a healthy payout ratio with EPS at 31.67% and FCF at 14.73%, indicating strong potential for maintaining existing dividends while also reinvesting in growth opportunities.
📊 Cashflow & Capital Efficiency
Understanding Freeport-McMoRan's cash flow and capital efficiency offers insights into the company's operational effectiveness and investment potential. These factors are essential to ascertain long-term financial sustainability and return on capital employed.
| Year | 2023 | 2024 | 2025 |
|---|---|---|---|
| Free Cash Flow Yield | 0.75% | 4.27% | 1.52% |
| Earnings Yield | 3.02% | 3.42% | 3.00% |
| CAPEX to Operating Cash Flow | 91.38% | 67.15% | 80.11% |
| Stock-based Compensation to Revenue | 0.48% | 0.43% | 0% |
| Free Cash Flow / Operating Cash Flow Ratio | 8.62% | 32.85% | 19.89% |
The financial indicators show strong cash flow stability with improving capital efficiency metrics, indicating robust operational performance and sustainability.
📊 Balance Sheet & Leverage Analysis
A careful inspection of the balance sheet and leverage ratios highlight Freeport-McMoRan’s financial health, liquidity positions, and debt management strategies. Such data are vital in assessing financial resilience and strategic flexibility.
| Year | 2023 | 2024 | 2025 |
|---|---|---|---|
| Debt-to-Equity | 61.10% | 55.39% | 60.86% |
| Debt-to-Assets | 19.43% | 17.75% | 19.77% |
| Debt-to-Capital | 37.93% | 35.65% | 37.83% |
| Net Debt to EBITDA | 0.53x | 0.61x | 0.93x |
| Current Ratio | 2.42 | 2.42 | 2.29 |
| Quick Ratio | 1.38 | 1.18 | 1.05 |
| Financial Leverage | 3.15 | 3.12 | 3.08 |
The company displays strong balance sheet metrics, showing an ability to manage leverage effectively while maintaining liquidity and financial flexibility, providing confidence in its growth and repayment capacities.
📊 Fundamental Strength & Profitability
This section analyzes the intrinsic strength of Freeport-McMoRan, focusing on profitability ratios and efficiency metrics. Such evaluations are essential to understand the value generation capacity and operational efficiency of the company.
| Year | 2023 | 2024 | 2025 |
|---|---|---|---|
| Return on Equity | 11.03% | 10.71% | 11.66% |
| Return on Assets | 3.51% | 3.43% | 3.79% |
| Margins: Net | 8.11% | 7.40% | 8.56% |
| Margins: EBIT | 28.72% | 28.39% | 25.30% |
| Margins: EBITDA | 37.83% | 37.19% | 34.02% |
| Margins: Gross | 30.30% | 29.48% | 26.98% |
| Research & Development to Revenue | 0% | 0% | 0% |
The profitability and fundamental strengths indicate Freeport-McMoRan’s efficiency in maximizing returns and capitalizing on margins, supporting a strong competitive position in the market.
📊 Price Development
🗣️ Dividend Scoring System
| Criteria | Score | Description |
|---|---|---|
| Dividend yield | 4 | |
| Dividend Stability | 5 | |
| Dividend growth | 3 | |
| Payout ratio | 4 | |
| Financial stability | 4 | |
| Dividend continuity | 5 | |
| Cashflow Coverage | 3 | |
| Balance Sheet Quality | 4 |
Total Score: 32/40
✅ Rating
In summary, Freeport-McMoRan Inc. offers a stable dividend investment opportunity with a potential for modest growth and capital appreciation. Given its solid financials, strategic dividend policy, and robust market position, it remains a worthy consideration for income-focused investors seeking reliable, long-term capital returns.
Smart Data Insight
Master the Perfect Entry & Exit for this Stock
Don't leave your profits to chance. Historically, this stock follows specific seasonal patterns that institutional traders use to maximize returns.
- ✅ Identify the "Golden Buying Window"
- ✅ Avoid high-risk correction cycles
- ✅ Backtested data from the last 20+ years