March 24, 2026 a 03:31 am

FCX: Dividend Analysis - Freeport-McMoRan Inc.
Freeport-McMoRan Inc. (FCX) represents a potent force in the mining industry, offering a considerable market presence backed by years of consistent dividend payments. While the growth in dividend payouts has been modest, the company has showcased a commitment to shareholder returns through its resilience in maintaining dividends across varied market conditions. The analyses suggest a stable dividend yield, bolstered by robust financial metrics over the years.
📊 Overview
Below is a detailed overview of Freeport-McMoRan Inc.'s dividend metrics, key to understanding its dividend performance and industry standing.
| Key Metric | Value |
|---|---|
| Sector | Basic Materials |
| Dividend yield | 1.00% |
| Current dividend per share | 0.60 USD |
| Dividend history | 25 years |
| Last cut or suspension | None |
🗣️ Dividend History
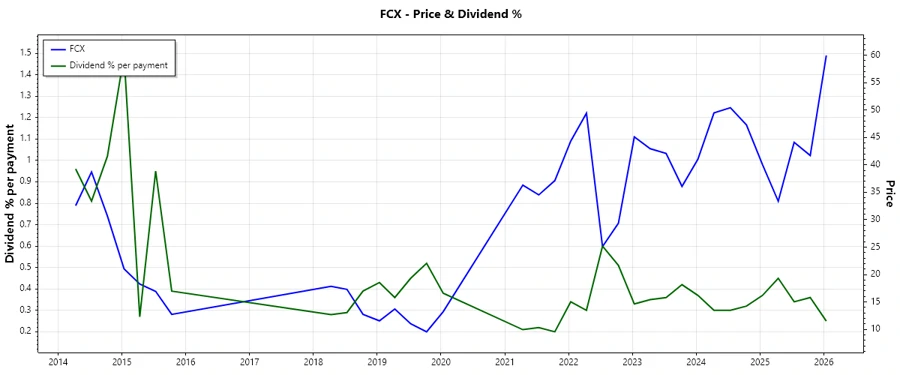
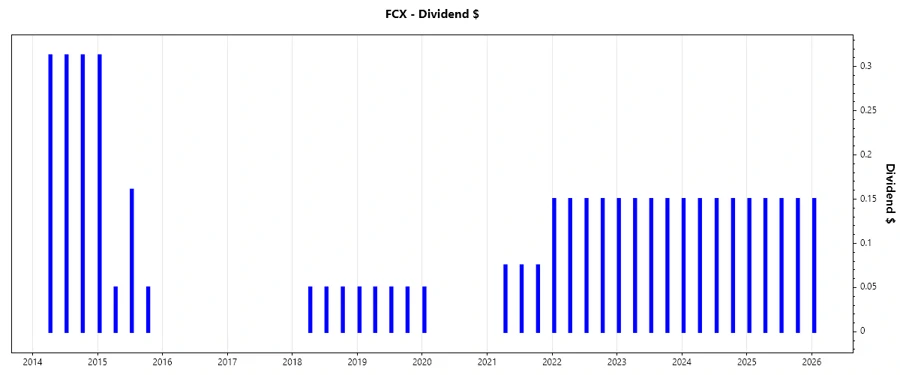
The dividend history of Freeport-McMoRan Inc. illustrates the company's commitment to returning value to shareholders. Consistent dividends are essential for those seeking steady income from their investments.
| Year | Dividend per Share (USD) |
|---|---|
| 2026 | 0.15 |
| 2025 | 0.60 |
| 2024 | 0.60 |
| 2023 | 0.60 |
| 2022 | 0.60 |
📈 Dividend Growth
Dividend growth analysis is vital for evaluating a company's potential for increasing shareholder value. The lack of significant growth in recent years indicates modest but stable returns.
| Time | Growth |
|---|---|
| 3 years | 0% |
| 5 years | 0.64% |
The average dividend growth is 0.64% over 5 years. This shows moderate but steady dividend growth.
💡 Payout Ratio
Payout ratios help to understand the proportion of earnings paid out as dividends, crucial for assessing dividend sustainability.
| Key figure | Ratio |
|---|---|
| EPS-based | 39.35% |
| Free Cash Flow-based | 15.36% |
With an EPS payout ratio of 39.35% and an FCF payout ratio of 15.36%, these figures suggest a conservative dividend payout strategy, allowing room for reinvestment in growth opportunities.
💸 Cashflow & Capital Efficiency
An evaluation of cash flow metrics offers insights into financial health and capital management efficiency.
| Year | 2025 | 2024 | 2023 |
|---|---|---|---|
| Free Cash Flow Yield | 1.52% | 4.27% | 0.74% |
| Earnings Yield | 3.01% | 3.42% | 3.02% |
| CAPEX to Operating Cash Flow | 80.11% | 67.15% | 91.38% |
| Stock-based Compensation to Revenue | 0.47% | 0.43% | 0.48% |
| Free Cash Flow / Operating Cash Flow Ratio | 19.89% | 32.85% | 8.62% |
The cash flow data indicates mixed capital efficiency, with a focus on reinvestment and prudent cash flow management balanced against stock-based incentives.
📉 Balance Sheet & Leverage Analysis
The company's leverage and liquidity help assess its long-term financial stability and risk profile.
| Year | 2025 | 2024 | 2023 |
|---|---|---|---|
| Debt-to-Equity | 0.61 | 0.55 | 0.61 |
| Debt-to-Assets | 0.20 | 0.18 | 0.19 |
| Debt-to-Capital | 0.38 | 0.36 | 0.38 |
| Net Debt to EBITDA | 0.93 | 0.61 | 0.53 |
| Current Ratio | 2.29 | 2.41 | 2.42 |
| Quick Ratio | 1.05 | 1.18 | 1.38 |
| Financial Leverage | 3.08 | 3.12 | 3.15 |
The healthy ratios suggest strong liquidity and manageable leverage, indicating a robust financial foundation to withstand market volatilities.
✅ Fundamental Strength & Profitability
Profitability metrics reflect how efficiently the company manages its resources to generate profits.
| Year | 2025 | 2024 | 2023 |
|---|---|---|---|
| Return on Equity | 11.66% | 10.71% | 11.03% |
| Return on Assets | 3.79% | 3.43% | 3.51% |
| Margins: Net | 8.56% | 7.40% | 8.11% |
| EBIT | 25.30% | 28.39% | 28.72% |
| EBITDA | 34.02% | 37.19% | 37.83% |
| Gross | 26.98% | 29.48% | 30.30% |
| Research & Development to Revenue | 0% | 0% | 0% |
The company demonstrates solid profitability and efficiency in resource management, underpinning its competitive position in the market.
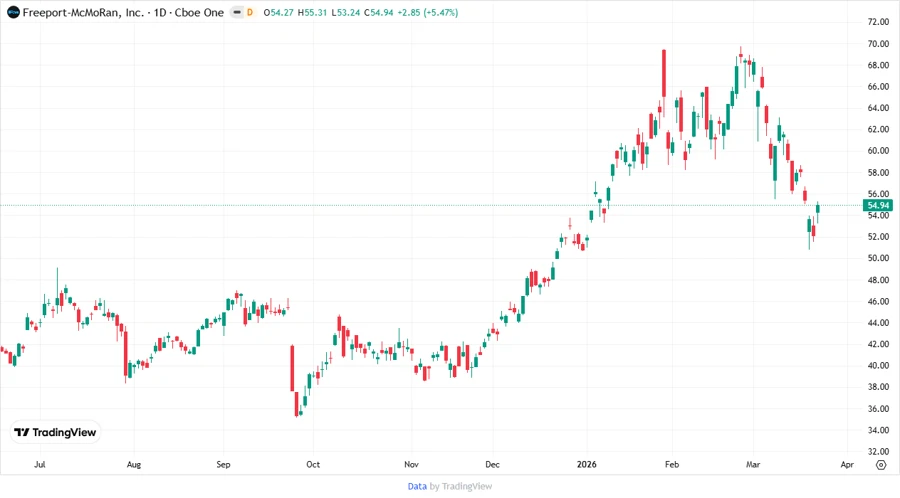
📈 Price Development
📊 Dividend Scoring System
| Criteria | Score | Score Bar |
|---|---|---|
| Dividend yield | 3 | |
| Dividend Stability | 4 | |
| Dividend growth | 2 | |
| Payout ratio | 3 | |
| Financial stability | 4 | |
| Dividend continuity | 5 | |
| Cashflow Coverage | 3 | |
| Balance Sheet Quality | 4 |
Total Score: 28/40
🗣️ Rating
In conclusion, Freeport-McMoRan Inc. is a resilient player in its sector with a sustained commitment to its dividend policy, albeit with modest growth. While the dividend yield is stable, the minimal growth suggests a conservative but dependable future outlook. This stock appeals to investors seeking reliability and stability over aggressive growth prospects.