February 22, 2026 a 11:30 am

FCX: Dividend Analysis - Freeport-McMoRan Inc.
The dividend profile of Freeport-McMoRan Inc. is characterized by a modest yield but stable payout history. While recent growth in dividends has been slow, the company's commitment to maintaining payout through periods of economic uncertainty is commendable. Investors might be attracted to this stability, although should be aware of the relatively low current yield.
📊 Overview
Freeport-McMoRan Inc. operates within the Materials sector, where it has carved out a reputation for consistent dividend payouts over a substantial duration.
| Sector | Dividend Yield | Current Dividend per Share | Dividend History | Last Cut or Suspension |
|---|---|---|---|---|
| Materials | 1.00% | 0.60 USD | 25 years | None |
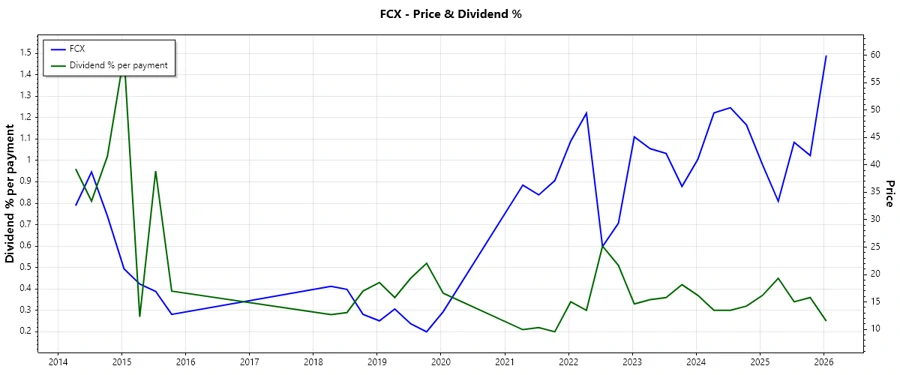
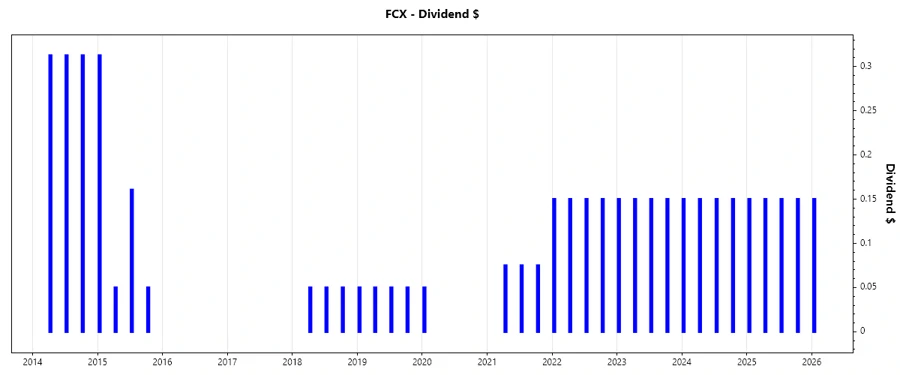
🗣️ Dividend History
The dividend history is a testament to the company's resilience and commitment to shareholder returns. The latest trends highlight sustained payouts amid market fluctuations.
| Year | Dividend per Share (USD) |
|---|---|
| 2026 | 0.15 |
| 2025 | 0.60 |
| 2024 | 0.60 |
| 2023 | 0.60 |
| 2022 | 0.60 |
📈 Dividend Growth
Growth in dividends, despite being modest over recent years, reflects a strategy of financial prudence and gradual enhancement of shareholder value. This growth rate suggests a steady augmentation which may appeal to long-term focused investors.
| Time | Growth |
|---|---|
| 3 years | 0% |
| 5 years | 0.64% |
The average dividend growth is 0.64% over 5 years. This shows moderate but steady dividend growth.
✅ Payout Ratio
Payout ratios are critical in assessing the sustainability of dividends. With a focus on EPS and Free Cash Flow, these metrics indicate a secure payout capability.
| Key Figure | Ratio |
|---|---|
| EPS-based | 39.35% |
| Free cash flow-based | 15.34% |
An EPS-based payout ratio of 39.35% suggests prudent cash management, while a FCF-based ratio of 15.34% underscores ample capacity for sustaining dividends.
⚠️ Cashflow & Capital Efficiency
Effective cash flow management ensures Freeport-McMoRan's ability to fund operations and investments without compromising dividend payments.
| Metric | 2023 | 2024 | 2025 |
|---|---|---|---|
| Free Cash Flow Yield | 0.75% | 4.27% | 1.52% |
| Earnings Yield | 3.02% | 3.42% | 3.00% |
| CAPEX to Operating Cash Flow | 91.38% | 67.15% | 80.11% |
| Stock-based Compensation to Revenue | 0.48% | 0.43% | 0.00% |
| Free Cash Flow / Operating Cash Flow Ratio | 8.62% | 32.85% | 19.89% |
The stability in cash flow reflects a robust platform for dividend health, complemented by moderate capital efficiency practices.
💼 Balance Sheet & Leverage Analysis
Examining the financial leverage of Freeport-McMoRan reveals its potential exposure to debt, yet points to balanced strategies for managing obligations.
| Metric | 2023 | 2024 | 2025 |
|---|---|---|---|
| Debt-to-Equity | 0.61 | 0.55 | 0.61 |
| Debt-to-Assets | 0.19 | 0.18 | 0.20 |
| Debt-to-Capital | 0.38 | 0.36 | 0.38 |
| Net Debt to EBITDA | 0.53 | 0.61 | 0.93 |
| Current Ratio | 2.42 | 2.42 | 2.29 |
| Quick Ratio | 1.38 | 1.18 | 1.05 |
| Financial Leverage | 3.14 | 3.12 | 3.08 |
Financial strategies in managing leverage and liquidity reflect a prudent approach, maintaining a healthy debt construct.
🏛️ Fundamental Strength & Profitability
Returns and margins highlight the company's operational efficiency and profit-generating capability, critical for sustaining investor trust.
| Metric | 2023 | 2024 | 2025 |
|---|---|---|---|
| Return on Equity | 11.03% | 10.71% | 11.66% |
| Return on Assets | 3.51% | 3.43% | 3.79% |
| Margins: Net | 8.11% | 7.40% | 8.56% |
| EBIT | 28.72% | 28.39% | 25.30% |
| EBITDA | 37.83% | 37.19% | 34.02% |
| Gross | 30.30% | 29.48% | 26.98% |
| Research & Development to Revenue | 0.00% | 0.00% | 0.00% |
The figures suggest efficient capital utilization and a focused effort to enhance profitability.
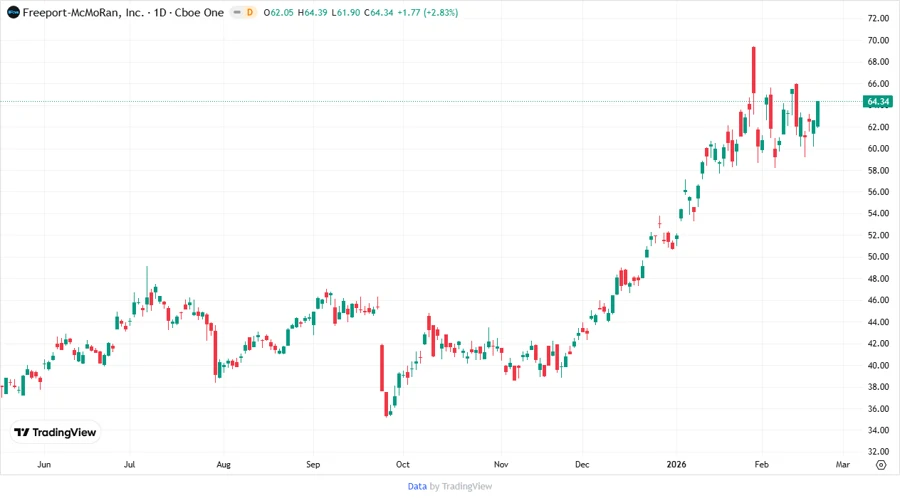
📉 Price Development
🛠️ Dividend Scoring System
| Category | Score | Indicator |
|---|---|---|
| Dividend yield | 3 | |
| Dividend Stability | 5 | |
| Dividend growth | 2 | |
| Payout ratio | 4 | |
| Financial stability | 4 | |
| Dividend continuity | 5 | |
| Cashflow Coverage | 3 | |
| Balance Sheet Quality | 4 |
Overall Score: 30 out of 40
🔍 Rating
Freeport-McMoRan Inc. presents a reliable dividend opportunity, especially appealing to investors valuing dividend continuity and financial stability over high yield. However, those seeking significant income growth might find its dividend growth potential limited. Overall, it remains a solid choice for risk-averse, income-focused portfolios.
Smart Data Insight
Master the Perfect Entry & Exit for this Stock
Don't leave your profits to chance. Historically, this stock follows specific seasonal patterns that institutional traders use to maximize returns.
- ✅ Identify the "Golden Buying Window"
- ✅ Avoid high-risk correction cycles
- ✅ Backtested data from the last 20+ years