October 15, 2025 a 03:31 am
FCX: Dividend Analysis - Freeport-McMoRan Inc.
The analysis of Freeport-McMoRan Inc. reveals a strategic position in the materials sector, underpinned by a moderate yet consistent dividend yield and a solid growth trajectory over recent years. Despite facing challenges due to historical dividend cuts, the company presents a stable payout ratio. However, the capital efficiency and leverage models reflect the need for cautious monitoring given the complex nature of its operational environment.
📊 Overview
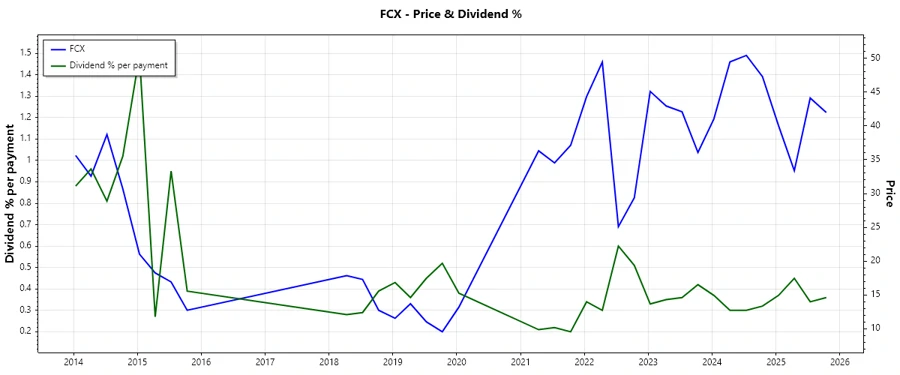
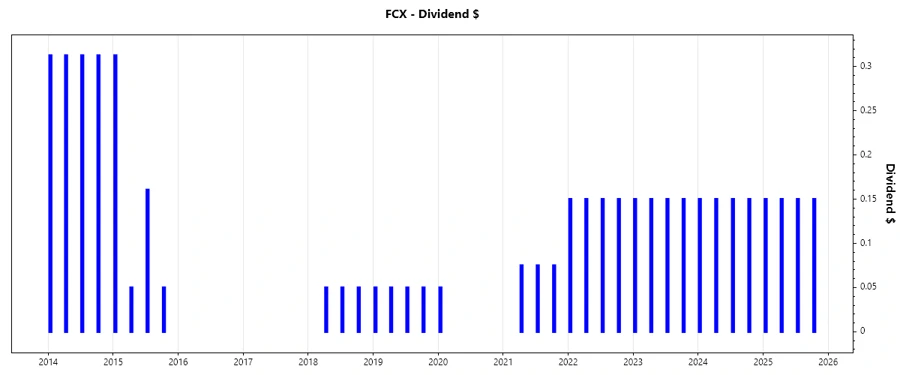
Freeport-McMoRan Inc., a giant in the Basic Materials sector, maintains a dividend yield of 1.43%. With a steady current dividend per share of 0.60 USD, the company's dividend history spans 24 years, experiencing its last cut or suspension in 2020.
| Parameter | Value |
|---|---|
| Sector | Basic Materials |
| Dividend yield | 1.43 % |
| Current dividend per share | 0.60 USD |
| Dividend history | 24 years |
| Last cut or suspension | 2020 |
🗣️ Dividend History
The company's dividend history indicates resilience despite economic challenges, providing consistency to long-term investors. A strong dividend history is essential for trust and investor satisfaction.
| Year | Dividend per Share (USD) |
|---|---|
| 2025 | 0.60 |
| 2024 | 0.60 |
| 2023 | 0.60 |
| 2022 | 0.60 |
| 2021 | 0.225 |
📈 Dividend Growth
Dividend growth reflects the company's commitment to increasing shareholder returns over time, proving essential for attracting growth-oriented investors.
| Time | Growth |
|---|---|
| 3 years | 38.67 % |
| 5 years | 24.57 % |
The average dividend growth is 24.57% over 5 years. This shows moderate but steady dividend growth.
✅ Payout Ratio
Payout ratios are pivotal as they balance between rewarding shareholders and reinvesting in company operations. Our focus on EPS and free cash flow provides insight into sustainability and profit allocation.
| Key figure | Ratio |
|---|---|
| EPS-based | 45.21 % |
| Free cash flow-based | 20.85 % |
The EPS payout ratio stands at 45.21%, while the free cash flow payout ratio is at 20.85%. These ratios indicate a balanced approach to payouts while ensuring sufficient capital for operations and growth.
💡 Cashflow & Capital Efficiency
Evaluating cash flow performance and capital efficiency metrics provides a deeper understanding of operational success and financial health.
| Metric | 2024 | 2023 | 2022 |
|---|---|---|---|
| Free Cash Flow Yield | 4.27 % | 0.75 % | 3.05 % |
| Earnings Yield | 3.42 % | 3.02 % | 6.32 % |
| CAPEX to Operating Cash Flow | 67.15 % | 91.38 % | 67.50 % |
| Stock-based Compensation to Revenue | 0.43 % | 0.48 % | 0.41 % |
| Free Cash Flow / Operating Cash Flow Ratio | 32.85 % | 8.62 % | 32.50 % |
The capital efficiency metrics suggest a strategic financial leverage with noteworthy free cash flow maintenance, crucial for sustainable growth.
⚖️ Balance Sheet & Leverage Analysis
The balance sheet analysis reveals the company's approach to debt and financial risk, instrumental in evaluating long-term solvency and financial strength.
| Metric | 2024 | 2023 | 2022 |
|---|---|---|---|
| Debt-to-Equity | 55.39 % | 59.02 % | 70.41 % |
| Debt-to-Assets | 17.75 % | 18.77 % | 21.44 % |
| Debt-to-Capital | 35.65 % | 37.12 % | 41.32 % |
| Net Debt to EBITDA | 0.61 | 0.59 | 0.30 |
| Current Ratio | 2.42 | 2.42 | 2.46 |
| Quick Ratio | 1.18 | 1.38 | 1.64 |
| Financial Leverage | 3.12 | 3.14 | 3.28 |
The leverage and stability analysis exemplifies the company's careful debt control, building a robust platform for enduring fiscal health.
📊 Fundamental Strength & Profitability
Fundamentals and profitability ratios shed light on operational effectiveness and the ability to deliver value to shareholders.
| Metric | 2024 | 2023 | 2022 |
|---|---|---|---|
| Return on Equity | 10.71 % | 11.03 % | 22.25 % |
| Return on Assets | 3.43 % | 3.51 % | 6.77 % |
| Margins: Net | 7.49 % | 8.11 % | 14.83 % |
| Margins: EBIT | 28.74 % | 28.72 % | 31.18 % |
| Margins: EBITDA | 37.66 % | 37.83 % | 39.83 % |
| Margins: Gross | 28.59 % | 30.30 % | 34.68 % |
| R&D to Revenue | 0 % | 0 % | 0 % |
Overall, these metrics highlight significant profitability margins, proving the company's capability to maintain strong economic moats despite variable market dynamics.
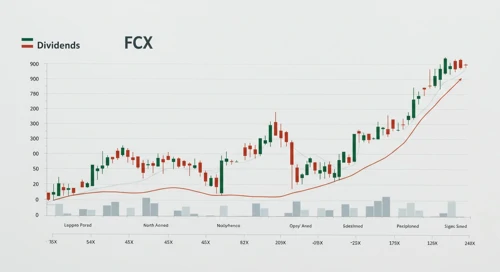
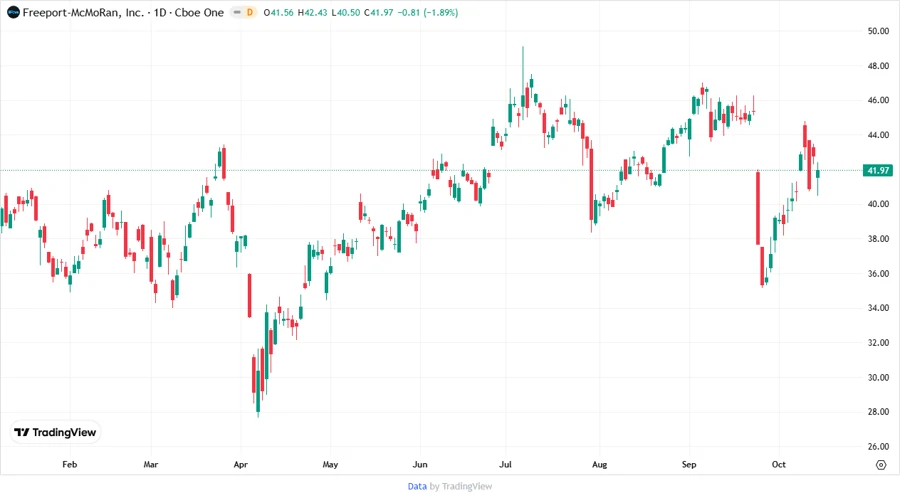
📉 Price Development
🏆 Dividend Scoring System
| Category | Score | Bar |
|---|---|---|
| Dividend yield | 2 | |
| Dividend Stability | 4 | |
| Dividend growth | 3 | |
| Payout ratio | 4 | |
| Financial stability | 4 | |
| Dividend continuity | 5 | |
| Cashflow Coverage | 3 | |
| Balance Sheet Quality | 4 |
Total Score: 29/40
🔍 Rating
Freeport-McMoRan Inc. receives a "hold" rating based on its solid dividend history and reasonable growth prospects. While the current yield remains moderate, the stability and consistency of dividends, along with strong financial metrics, provide assurance to potential investors. However, the volatility in capital expenditure and market conditions necessitates a vigilant approach.