July 02, 2025 a 12:46 pm


📊 FCX: Dividend Analysis - Freeport-McMoRan Inc.
Freeport-McMoRan Inc. offers a unique blend of moderate dividend yield and steady growth. With its robust payout ratios and a solid balance sheet, the company presents a compelling case for dividend investors. However, historical fluctuations in dividends and exposure to cyclical sectors could imply higher volatility. As such, continuous monitoring of financial health and market conditions is advisable.
🗣️ Overview
Freeport-McMoRan Inc. operates within a cyclical industry, focusing on mining and natural resources. Its dividend yield is currently at a modest 1.20%, reflecting relative stability in distributions over a 24-year history.
| Metric | Data |
|---|---|
| Sector | Materials |
| Dividend yield | 1.20% |
| Current dividend per share | $0.60 USD |
| Dividend history | 24 years |
| Last cut or suspension | None |
📈 Dividend History
Analyzing dividend histories offers insights into company stability and shareholder commitment. Consistent dividends denote financial health and management’s shareholder-centric approach.
| Year | Dividend per Share (USD) |
|---|---|
| 2025 | 0.38 |
| 2024 | 0.60 |
| 2023 | 0.60 |
| 2022 | 0.60 |
| 2021 | 0.225 |
📈 Dividend Growth
Dividend growth reflects the company’s earnings strength and management’s confidence. Sustainable growth over time is crucial for long-term investors.
| Time | Growth |
|---|---|
| 3 years | 38.67% |
| 5 years | 24.57% |
The average dividend growth is 24.57% over 5 years. This shows moderate but steady dividend growth.
📉 Payout Ratio
Payout ratios indicate how comfortably a company can pay dividends from its earnings and cash flow. High ratios may suggest potential stress on financial resources.
| Key figure | Ratio |
|---|---|
| EPS-based | 48.62% |
| Free cash flow-based | 53.57% |
The EPS payout ratio of 48.62% and FCF payout ratio of 53.57% reflect a prudent balance between rewarding shareholders and retaining capital for growth.
📈 Cashflow & Capital Efficiency
Key cash flow metrics illustrate a company's ability to generate sufficient funds to cover dividends and finance growth opportunities.
| Metric | 2024 | 2023 | 2022 |
|---|---|---|---|
| Free Cash Flow Yield | 4.25% | 0.75% | 3.05% |
| Earnings Yield | 3.41% | 3.02% | 6.33% |
| CAPEX to Operating Cash Flow | 67.15% | 91.38% | 67.50% |
| Stock-based Compensation to Revenue | 0.43% | 0.48% | 0.42% |
| Free Cash Flow / Operating Cash Flow Ratio | 32.85% | 8.62% | 32.50% |
The figures indicate solid cash flow generation, highlighting an ability to fund dividends and invest in growth efficiently.
🏦 Balance Sheet & Leverage Analysis
A strong balance sheet enhances a company's ability to manage obligations, withstand economic cycles, and protect dividends.
| Metric | 2024 | 2023 | 2022 |
|---|---|---|---|
| Debt-to-Equity | 0.55 | 0.59 | 0.68 |
| Debt-to-Assets | 0.18 | 0.19 | 0.21 |
| Debt-to-Capital | 0.36 | 0.37 | 0.41 |
| Net Debt to EBITDA | 0.61 | 0.59 | 0.27 |
| Current Ratio | 2.42 | 2.42 | 2.46 |
| Quick Ratio | 1.18 | 1.38 | 1.64 |
| Financial Leverage | 3.12 | 3.15 | 3.28 |
The company's leverage ratios suggest a manageable level of debt, ensuring financial flexibility and dividend security.
🔍 Fundamental Strength & Profitability
Profitability metrics offer insights into how effectively management can convert revenues into net income.
| Metric | 2024 | 2023 | 2022 |
|---|---|---|---|
| Return on Equity | 10.74% | 11.03% | 22.30% |
| Return on Assets | 3.44% | 3.51% | 6.79% |
| Net Profit Margin | 7.42% | 8.06% | 15.22% |
| Gross Margin | 30.09% | 31.33% | 33.76% |
| EBIT Margin | 28.39% | 28.53% | 31.94% |
| EBITDA Margin | 37.19% | 37.58% | 40.80% |
Profit margins and asset returns highlight efficient operations and robust financial health supporting investor confidence.
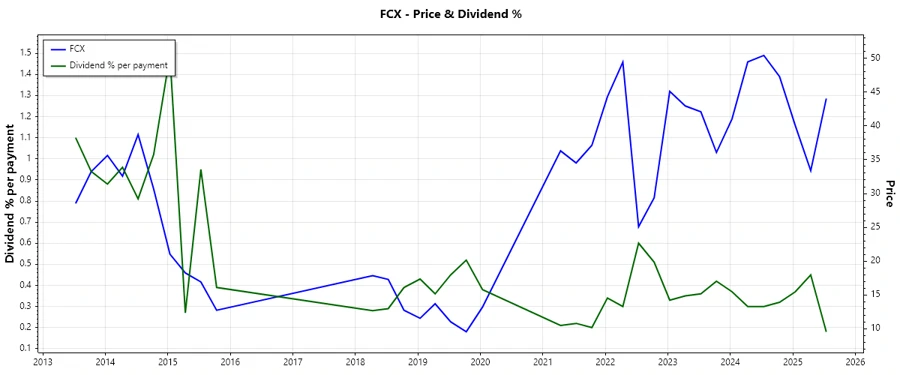
📈 Price Development
✅ Dividend Scoring System
| Category | Score | Visual Representation |
|---|---|---|
| Dividend yield | 3 | |
| Dividend Stability | 4 | |
| Dividend Growth | 4 | |
| Payout Ratio | 3 | |
| Financial Stability | 4 | |
| Dividend Continuity | 5 | |
| Cashflow Coverage | 4 | |
| Balance Sheet Quality | 4 |
Overall Score: 31/40
⭐ Rating
Freeport-McMoRan Inc. achieves a strong dividend rating bolstered by a blend of stability, growth, and financial resilience. Its solid record and promising outlook warrant a favorable recommendation for dividend-conscious investors. Continuous evaluation is advised to mitigate sector-related risks.