October 25, 2025 a 02:03 pm
FAST: Trend and Support & Resistance Analysis - Fastenal Company
Fastenal Company has been a reliable player in the industrial and construction supply market. Analyzing recent data, the stock has shown substantial activity that reflects shifts prevalent in the broader market. While short-term fluctuations have been notable, analysis of key price indicators will provide a deeper understanding of the trend direction and key support and resistance levels. Such insights are crucial for investors looking to capitalize on potential market movements in this segment.
Trend Analysis
| Date | Closing Price | Trend |
|---|---|---|
| 2025-10-24 | 42.87 | ▼ |
| 2025-10-23 | 42.99 | ▼ |
| 2025-10-22 | 42.6 | ▼ |
| 2025-10-21 | 43.32 | ▲ |
| 2025-10-20 | 42.99 | ▲ |
| 2025-10-17 | 42.46 | ▼ |
| 2025-10-16 | 41.96 | ▼ |
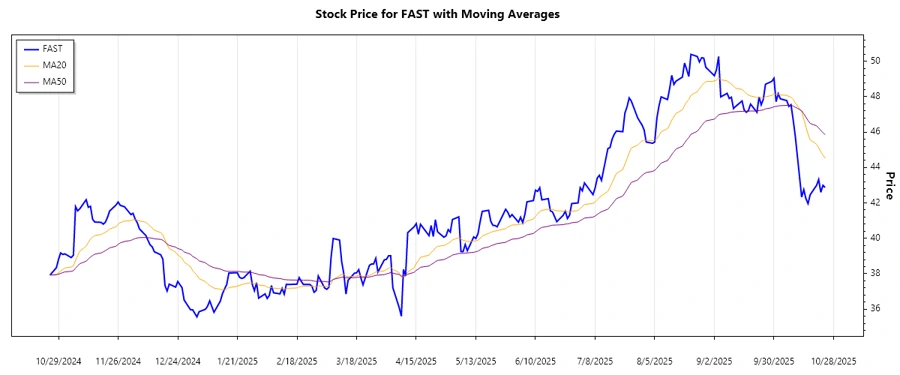
The EMA20 is currently below the EMA50, indicating a prevailing downtrend. This downtrend is supported by consistently lower closing prices over the recent days.
Support and Resistance
| Zone Type | Range |
|---|---|
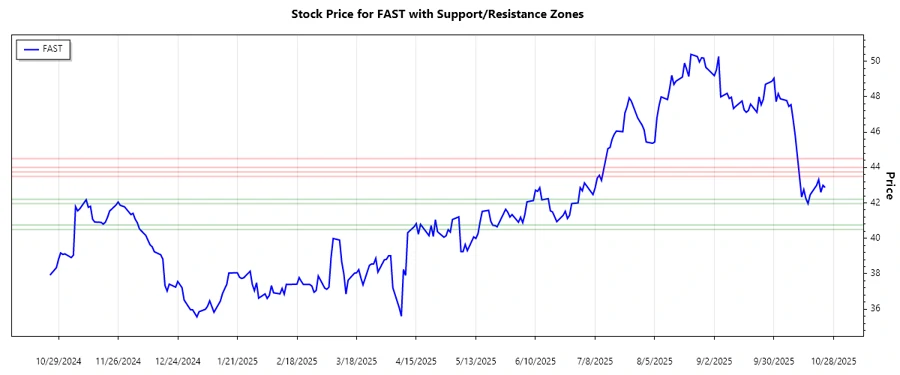
| Support Zone 1 | 41.96 - 42.20 ▼ |
| Support Zone 2 | 40.50 - 40.75 ▼ |
| Resistance Zone 1 | 43.50 - 43.75 ▲ |
| Resistance Zone 2 | 44.00 - 44.50 ▲ |
The current price is hovering near the lower support zone, indicating potential for a rebound if it holds, but a break below could see further declines.
Conclusion
The Fastenal Company stock is presently in a downtrend, as confirmed by the trend analysis where EMA20 remains below EMA50. Important support levels are being tested, and investors should watch closely for a break or hold that could indicate future directional movement for the stock. While the market exhibits weakness, the resilience in the underlying business fundamentals and industrial demand might offer a basis for a reversal. As Fastenal plays a significant role in industrial supply chains globally, macroeconomic trends will heavily influence the stock's direction.
Smart Data Insight
Master the Perfect Entry & Exit for this Stock
Don't leave your profits to chance. Historically, this stock follows specific seasonal patterns that institutional traders use to maximize returns.
- ✅ Identify the "Golden Buying Window"
- ✅ Avoid high-risk correction cycles
- ✅ Backtested data from the last 20+ years