July 15, 2025 a 04:04 am
FAST: Trend and Support & Resistance Analysis - Fastenal Company
The Fastenal Company, a leader in the distribution of industrial and construction supplies, has demonstrated notable price movements over the past months. With trends indicating business resilience amidst market fluctuations, Fastenal's share prices have recently showcased a significant upward momentum. This analysis aims to delve into the historical data and provide insights into the trends and critical price zones that investors should be aware of.
Trend Analysis
| Date | Closing Price | Trend |
|---|---|---|
| 2025-07-14 | 45.07 | ▲ |
| 2025-07-11 | 43.27 | ▲ |
| 2025-07-10 | 43.56 | ▲ |
| 2025-07-09 | 43.40 | ▲ |
| 2025-07-08 | 42.84 | ▲ |
| 2025-07-07 | 42.47 | ▲ |
| 2025-07-03 | 43.13 | ▲ |
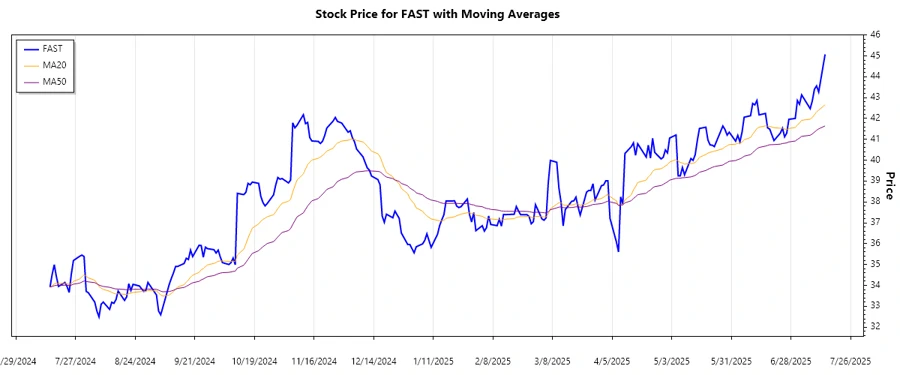
The trend analysis indicates an overall upward trend in recent weeks, characterized by higher highs and incremental gains.
Support and Resistance
| Zone Type | Zone Range |
|---|---|
| Support Zone 1 | 40.00 - 41.00 ▼ |
| Support Zone 2 | 41.50 - 42.50 ▼ |
| Resistance Zone 1 | 43.50 - 44.50 ▲ |
| Resistance Zone 2 | 44.50 - 45.50 ▲ |
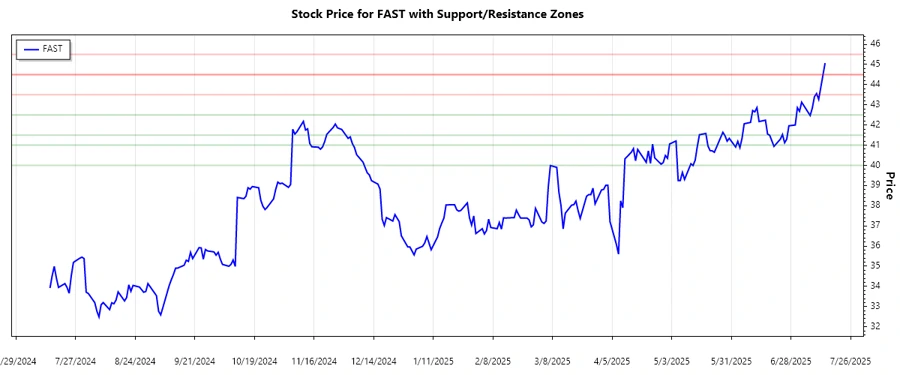
The current price level is within the Resistance Zone 2, suggesting a potential challenge to break out higher unless further buying pressure increases.
Conclusion
Fastenal's stock demonstrates an evident upward trend, reflecting positive momentum in recent market activities. With key support zones established between $40.00 and $42.50, and resistance areas identified from $43.50 to $45.50, investors should monitor price actions around these levels. The current trading range suggests potential challenges to breakout beyond current resistance, but opportunities for gains remain if bullish momentum sustains. Analysts should remain vigilant for any macroeconomic factors or market news that could influence Fastenal’s stock trajectory.
Smart Data Insight
Master the Perfect Entry & Exit for this Stock
Don't leave your profits to chance. Historically, this stock follows specific seasonal patterns that institutional traders use to maximize returns.
- ✅ Identify the "Golden Buying Window"
- ✅ Avoid high-risk correction cycles
- ✅ Backtested data from the last 20+ years