April 30, 2026 a 02:46 am

FAST: Dividend Analysis - Fastenal Company
Fastenal Company, with its robust dividend history and sustainable growth, presents itself as a reliable investment for income-seeking investors. With a consistent dividend yield and a stable history of payments, Fastenal has proven its resilience in maintaining shareholder returns. However, the high payout ratios could impose limitations on future dividend increases unless earnings growth accelerates.
📊 Overview
Fastenal operates in the Industrials sector, characterized by its stable and income-oriented dividend approach. The company pays a dividend yield of 2.06% with a current dividend per share of $0.88. With an impressive 36-year track record of uninterrupted dividends and no recent cuts or suspensions, Fastenal demonstrates strong financial footing in dividend management.
| Metric | Details |
|---|---|
| Sector | Industrials |
| Dividend yield | 2.06% |
| Current dividend per share | 0.88 USD |
| Dividend history | 36 years |
| Last cut or suspension | None |
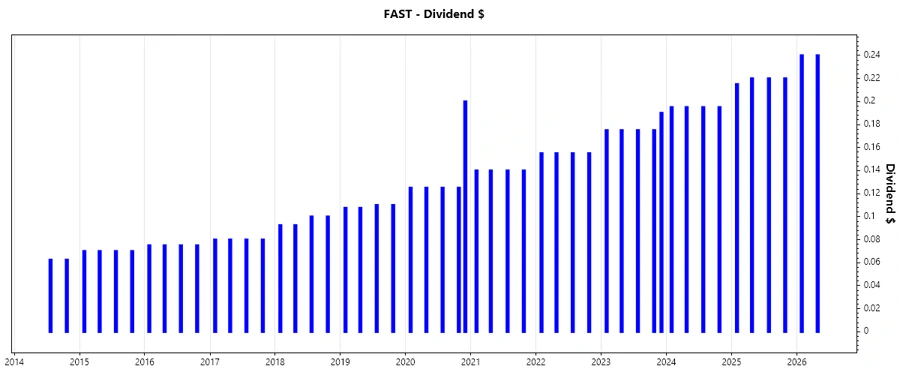
🗣️ Dividend History
Fastenal’s commitment to consistent dividend payments over the past 36 years reflects its robust financial management. This long-term stability is crucial for investors focusing on predictable income streams.
| Year | Dividend per Share (USD) |
|---|---|
| 2026 | 0.48 |
| 2025 | 0.88 |
| 2024 | 0.78 |
| 2023 | 0.89 |
| 2022 | 0.62 |
📈 Dividend Growth
Dividend growth indicates a company's earnings power and its ability to increase shareholder value over time. Fastenal reports a 3-year growth rate of 12.17% and a 5-year growth rate of 4.56%.
| Time | Growth |
|---|---|
| 3 years | 12.17% |
| 5 years | 4.56% |
The average dividend growth is 4.56% over 5 years. This shows moderate but steady dividend growth.
⚠️ Payout Ratio
Payout ratios indicate sustainability of dividend payments relative to earnings and cash flows. Fastenal maintains an EPS-based payout ratio of 77.30% and an FCF-based payout ratio of 86.34%.
| Key figure | Ratio |
|---|---|
| EPS-based | 77.30% |
| Free cash flow-based | 86.34% |
The payout ratios suggest a high level of earnings distribution, indicating that future dividend increases may be limited unless supported by earnings expansion.
🏦 Cashflow & Capital Efficiency
Cashflow and capital efficiency address the firm's ability to generate cash and efficiently utilize capital. Fastenal demonstrates a strong operating cash flow coverage and a conservative capital expenditure profile.
| Metric | 2023 | 2024 | 2025 |
|---|---|---|---|
| Free Cash Flow Yield | 3.40% | 2.30% | 2.28% |
| Earnings Yield | 3.12% | 2.79% | 2.73% |
| CAPEX to Operating Cash Flow | 12.06% | 19.30% | 17.60% |
| Stock-based Compensation to Revenue | 0.10% | 0.11% | 0.10% |
| Free Cash Flow / Operating Cash Flow Ratio | 87.94% | 80.70% | 81.07% |
Fastenal shows competent cash flow generation capabilities with significant return on capital, supporting sustainability and investment needs.
📊 Balance Sheet & Leverage Analysis
Understanding leverage and balance sheet strength is essential for assessing financial risk and resilience. Fastenal's low debt metrics indicate prudent financial management.
| Metric | 2023 | 2024 | 2025 |
|---|---|---|---|
| Debt-to-Equity | 15.98% | 13.42% | 11.21% |
| Debt-to-Assets | 11.99% | 10.33% | 8.75% |
| Debt-to-Capital | 13.78% | 11.83% | 10.08% |
| Net Debt to EBITDA | 18.39% | 13.58% | 9.97% |
| Current Ratio | 4.57 | 4.67 | 4.85 |
| Quick Ratio | 2.27 | 2.28 | 2.41 |
| Financial Leverage | 1.33 | 1.30 | 1.28 |
Fastenal's stable balance sheet and low leverage indicate a robust financial position capable of weathering economic downturns.
💪 Fundamental Strength & Profitability
Profitability ratios highlight a company’s operational efficiency and potential for sustained growth.
| Metric | 2023 | 2024 | 2025 |
|---|---|---|---|
| Return on Equity | 34.49% | 31.82% | 31.91% |
| Return on Assets | 25.88% | 24.49% | 24.90% |
| Margins: Net | 15.72% | 15.25% | 15.35% |
| Margins: Gross | 45.66% | 45.08% | 45.01% |
With strong returns and healthy margins, Fastenal demonstrates proficiency in capitalizing on its assets to generate shareholder returns.
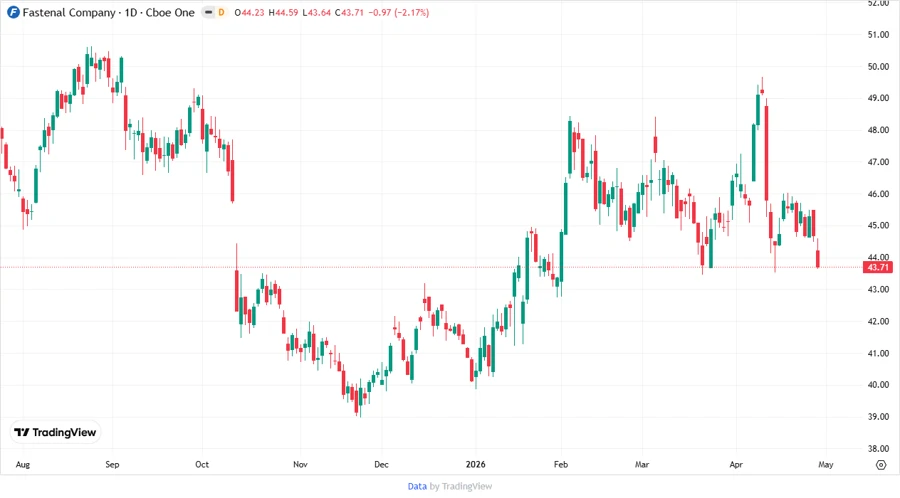
📉 Price Development
✅ Dividend Scoring System
| Criteria | Score | Score Bar |
|---|---|---|
| Dividend yield | 3 | |
| Dividend Stability | 5 | |
| Dividend growth | 4 | |
| Payout ratio | 2 | |
| Financial stability | 4 | |
| Dividend continuity | 5 | |
| Cashflow Coverage | 3 | |
| Balance Sheet Quality | 4 |
Total Score: 30/40
📝 Rating
Fastenal presents an enticing profile for conservative dividend investors seeking stability and modest growth. While current payout ratios are somewhat high, the company's strong balance sheet and proven dividend history provide reassurance of sustained returns. Investors should consider potential growth in earnings to support future dividend raises for improved total returns.
Smart Data Insight
Master the Perfect Entry & Exit for this Stock
Don't leave your profits to chance. Historically, this stock follows specific seasonal patterns that institutional traders use to maximize returns.
- ✅ Identify the "Golden Buying Window"
- ✅ Avoid high-risk correction cycles
- ✅ Backtested data from the last 20+ years