January 27, 2026 a 12:46 pm

📊 FAST: Dividend Analysis - Fastenal Company
The Fastenal Company demonstrates a firm commitment to rewarding its shareholders with an ongoing history of dividend payments. The firm's strong balance sheet and consistent cash flow generation position it as a dependable dividend payer. However, concerns about high payout ratios may need addressing to ensure long-term dividend sustainability.
Overview
Fastenal Company operates within the Industrial sector and has maintained a dividends-paying history for an impressive 36 years. The current dividend yield stands at 2.06%, while the dividend per share is $0.88. The company has not experienced any dividend cuts or suspensions, highlighting its stable dividend policy.
| Metric | Details |
|---|---|
| Sector | Industrial |
| Dividend yield | 2.06% |
| Current dividend per share | 0.88 USD |
| Dividend history | 36 years |
| Last cut or suspension | None |
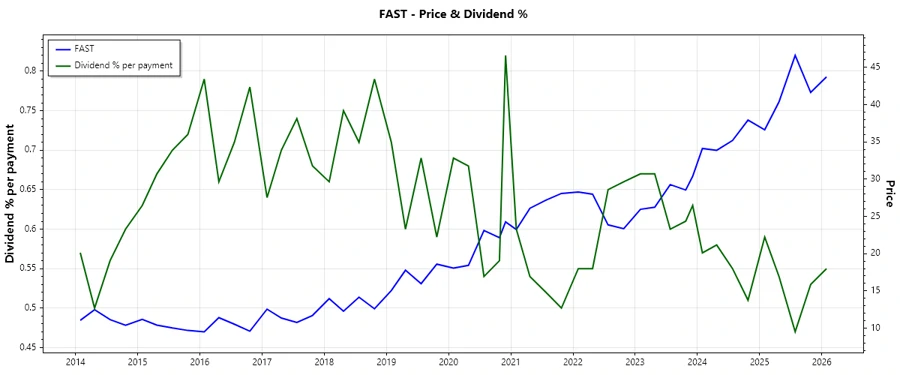
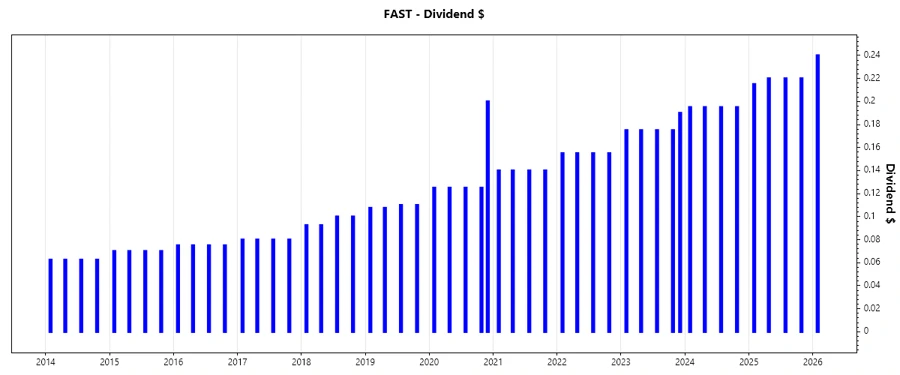
🗣️ Dividend History
A strong dividend history is a testament to a company's reliable earnings and steady cash flow. Fastenal's consistent payouts over several decades underscore the company's robust financial health.
| Year | Dividend per Share (USD) |
|---|---|
| 2026 | 0.24 |
| 2025 | 0.88 |
| 2024 | 0.78 |
| 2023 | 0.89 |
| 2022 | 0.62 |
📈 Dividend Growth
Dividend growth is vital for maintaining purchasing power over time and attracting growth-oriented investors. Fastenal has experienced a dividend growth of 12.17% over 3 years and 4.56% over 5 years, reflecting a moderate but promising trend.
| Time | Growth |
|---|---|
| 3 years | 12.17 % |
| 5 years | 4.56 % |
The average dividend growth is 4.56 % over 5 years. This shows moderate but steady dividend growth.
⚠️ Payout Ratio
Payout ratios are crucial for assessing the sustainability of a company’s dividend policy. Fastenal's EPS-based payout ratio is high at 79.81%, whereas its FCF-based payout ratio stands at a concerning 95.63%. High payout ratios could indicate limited room for future dividend increases.
| Ratio | Value |
|---|---|
| EPS-based | 79.81 % |
| Free cash flow-based | 95.63 % |
The high payout ratios suggest that while Fastenal is committed to returning profits to shareholders, there remains little buffer for financial flexibility without future earnings growth.
✅ Cashflow & Capital Efficiency
Cash flow and capital efficiency metrics are vital for appraising a company's ability to sustain dividends. Fastenal's free cash flow yield and capex to operating cash flow ratios emphasize solid cash flow management, although stock-based compensation indicates a minimal impact on revenues.
| Metric | 2023 | 2024 | 2025 |
|---|---|---|---|
| Free Cash Flow Yield | 3.40% | 2.30% | 2.28% |
| Earnings Yield | 3.12% | 2.79% | 2.73% |
| CAPEX to Operating Cash Flow | 0.12 | 0.19 | 0.19 |
| Stock-based Compensation to Revenue | 0.10% | 0.11% | 0.10% |
| Free Cash Flow / Operating Cash Flow Ratio | 88% | 81% | 81% |
Fastenal demonstrates satisfactory cash flow stability and capital efficiency, which underlines its capability to maintain dividend payouts.
📊 Balance Sheet & Leverage Analysis
Analyzing balance sheet metrics and leverage is critical for understanding financial stability. Fastenal's conservative use of debt and high interest coverage suggest robust financial health.
| Metric | 2023 | 2024 | 2025 |
|---|---|---|---|
| Debt-to-Equity | 0.16 | 0.13 | 0.00 |
| Debt-to-Assets | 0.12 | 0.10 | 0.00 |
| Net Debt to EBITDA | 0.18 | 0.14 | 0.00 |
| Current Ratio | 4.57 | 4.67 | 0.00 |
The balance sheet and leverage ratios reveal a low-risk financial structure, providing stability and supporting dividend continuity.
📉 Fundamental Strength & Profitability
High profitability margins and efficient use of equity translate to great shareholder returns. Fastenal’s strong return on equity and asset utilization underscore its operational efficiency.
| Metric | 2023 | 2024 | 2025 |
|---|---|---|---|
| Return on Equity | 34.49% | 31.82% | 0.00% |
| Net Margin | 15.72% | 15.25% | 15.35% |
| EBITDA Margin | 23.22% | 22.41% | 20.19% |
Fastenal's profitability strongly supports dividend payments, bolstered by high return metrics and stable net margins.
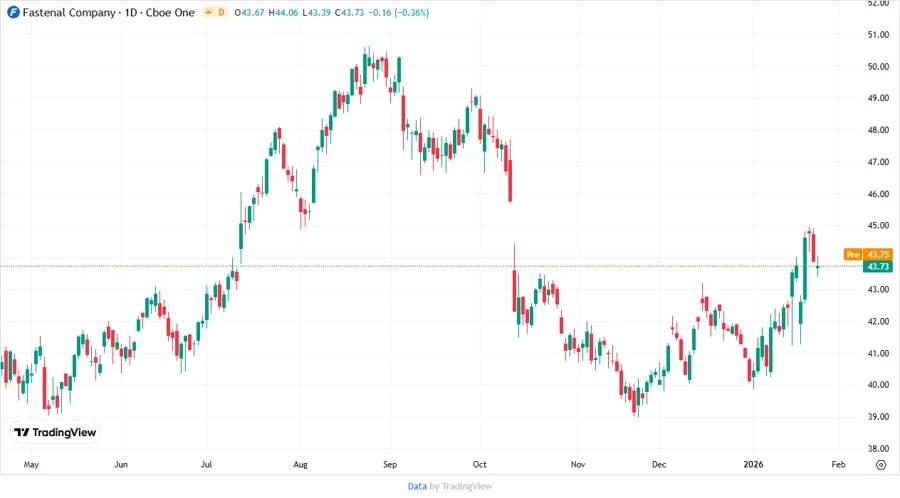
📈 Price Development
🗣️ Dividend Scoring System
| Category | Score | Score Level |
|---|---|---|
| Dividend yield | 4 | |
| Dividend Stability | 5 | |
| Dividend growth | 3 | |
| Payout ratio | 2 | |
| Financial stability | 5 | |
| Dividend continuity | 5 | |
| Cashflow Coverage | 3 | |
| Balance Sheet Quality | 5 |
Total Score: 32 out of 40
Rating
Fastenal Company emerges as a robust dividend-paying stock within the industrial sector, characterized by its unwavering dividend history and outstanding financial health. While the company's high payout ratios may prompt cautious optimism, its durable cash flow and excellent balance sheet quality underscore a promising future for income-focused investors. Therefore, we recommend Fastenal as a reliable long-term dividend investment, albeit with attention to future payout ratio adjustments.