
July 06, 2026 a 08:15 am
FANG: Trend and Support & Resistance Analysis - Diamondback Energy, Inc.
The Diamondback Energy, Inc. stock (FANG) is indicative of a volatile market with significant movements influenced by oil and natural gas prices. The company's large asset base in the Permian Basin and its extensive midstream infrastructure suggest potential for growth, yet the financial performance is intricately linked with global oil market dynamics. Its expansion and development strategies remain critical in driving future stock performance.
Trend Analysis
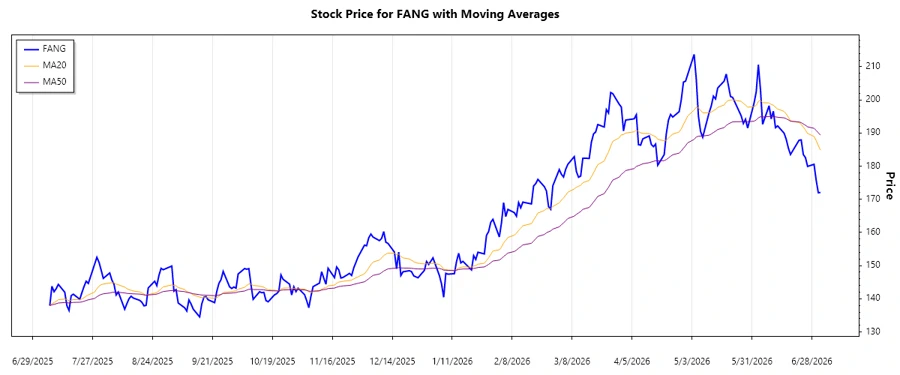
The trend analysis of Diamondback Energy Inc. reveals a pronounced downward momentum over the past two months. The calculation of EMA20 and EMA50 suggests a bearish scenario as the EMA20 remains below the EMA50. However, recent data may offer hints of stabilization, warranting a closer examination for potential reversal signals.
| Date | Closing Price | Trend |
|---|---|---|
| 2026-07-02 | $172.04 | ▼ Down |
| 2026-07-01 | $171.96 | ▼ Down |
| 2026-06-30 | $175.78 | ▼ Down |
| 2026-06-29 | $180.54 | ▼ Down |
| 2026-06-26 | $179.91 | ▼ Down |
| 2026-06-25 | $182.55 | ▼ Down |
| 2026-06-24 | $183.48 | ▼ Down |
Support and Resistance
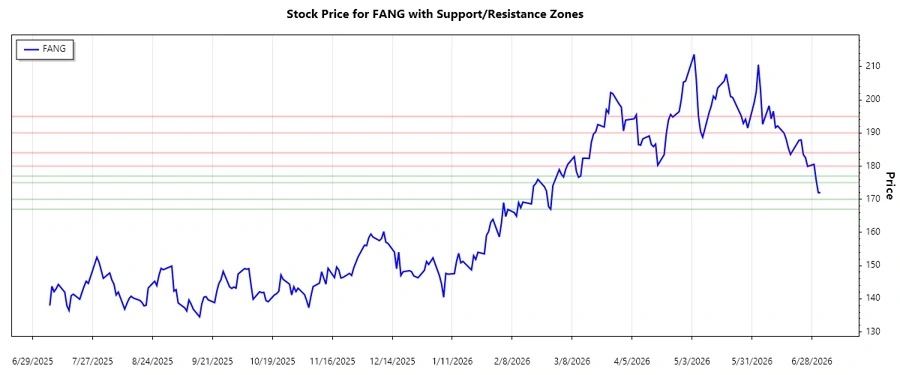
The support and resistance analysis suggests crucial zones around the levels of $166.98 - $170.00, indicating a significant lower boundary, while resistance is encountered at $180.00 - $184.00. The current price levels are approaching the lower support zone, which could be pivotal for forthcoming market sentiment and action.
| Zone Type | From | To |
|---|---|---|
| Support | $166.98 | $170.00 |
| Support | $175.00 | $177.00 |
| Resistance | $180.00 | $184.00 |
| Resistance | $190.00 | $195.00 |
Conclusion
Diamondback Energy's current stock status shows a bearish trend, with prices moving towards significant support zones. The firm's robust asset facilities and strategic basin locations provide a firm foundation but remain vulnerable to oil price fluctuations. While the historical downtrend persists, the approaching support zones could provide a potential bounce or consolidation. Analysts should watch for signals of stabilization or trend reversal at these critical points, as the company's expansive midstream infrastructure offers substantial upside potential alongside inherent market risks.
JSON Output:
Smart Data Insight
Master the Perfect Entry & Exit for this Stock
Don't leave your profits to chance. Historically, this stock follows specific seasonal patterns that institutional traders use to maximize returns.
- ✅ Identify the "Golden Buying Window"
- ✅ Avoid high-risk correction cycles
- ✅ Backtested data from the last 20+ years